A STUDY OF THE OCCUPATIONS OF ALUMNI
Research Assistant to the President
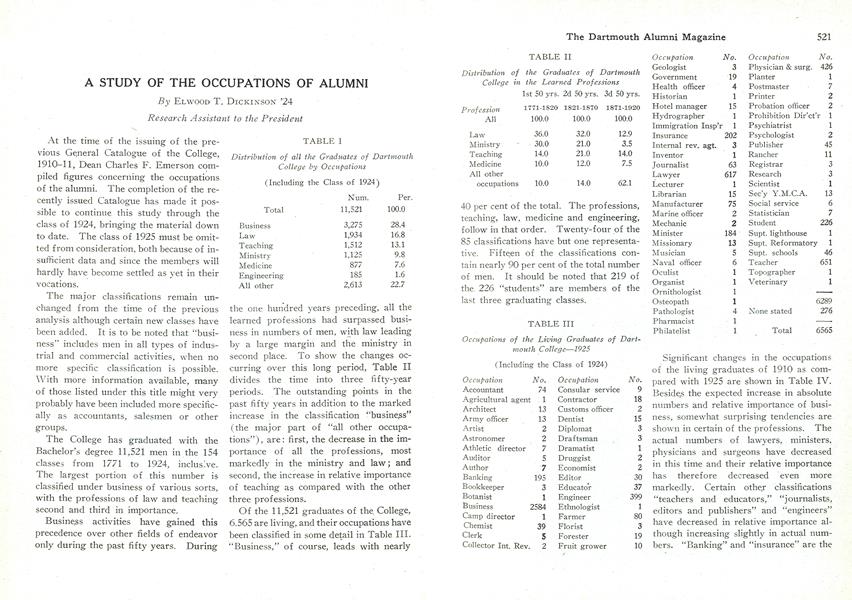
At the time of the issuing of the previous General Catalogue of the College, 1910-11, Dean Charles F. Emerson compiled figures concerning the occupations of the alumni. The completion of the recently issued Catalogue has made it possible to continue this study through the class of 1924, bringing the material down to date. The class of 1925 must be omitted from consideration, both because of insufficient data and since the members will hardly have become settled as yet in their vocations.
The major classifications remain unchanged from the time of the previous analysis although certain new classes have been added. It is to be noted that "business" includes men in all types of industrial and commercial activities, when no more specific classification is possible. With more information available, many of those listed under this title might very probably have been included more specifically as accountants, salesmen or other groups.
The College has graduated with the Bachelor's degree 11,521 men in the 154 classes from 1771 to 1924, inclusive. The largest portion of this number is classified under business of various sorts, with the professions of law and teaching second and third in importance.
Business activities have gained this precedence over other fields of endeavor only during the past fifty years. During
TABLE I
Distribution of all the Graduates of DartmouthCollege by Occupations (Including the Class of 1924) Num. Per. Total 11,521 100.0 Business 3,275 28.4 Law 1,934 16.8 Teaching 1,512 10.l Ministry 1,125 9.8 Medicine 877 7.6 Engineering 185 1.6 All other 2,613 22.7 the one hundred years preceding, all the learned professions had surpassed business in numbers of men, with law leading by a large margin and the ministry in second place. To show the changes occurring over this long period, Table II divides the time into three fifty-year periods. The outstanding points in the past fifty years in addition to the marked increase in the classification "business" (the major part of "all other occupations"), are: first, the decrease in the importance of all the professions, most markedly in the ministry and law; and second, the increase in relative importance of teaching as compared with the other three professions.
Of the 11,521 graduates of the, College, 6.565 are living, and their occupations have been classified in some detail in Table III. "Business," of course, leads with nearly
TABLE II
Distribution of the Graduates of DartmouthCollege in the Learned Professions Ist 50 yrs. 2d 50 yrs. 3d 50 yrs. Profession 1771-1820 1821-1870 1871-1920 All 100.0 100.0 100.0 Law 36.0 32.0 12.9 Ministry ' 30.0 21.0 3.5 Teaching 14.0 21.0 14.0 Medicine 10.0 12.0 7.5 All other occupations 10.0 14.0 62.1 40 per cent of the total. The professions, teaching, law, medicine and engineering, follow in that order. Twenty-four of the 85 classifications have but one representative. Fifteen of the classifications contain nearly 90 per cent of the total number of men. It should be noted that 219 of the. 226 "students" are members of the last three graduating classes.
TABLE III
Occupations of the Living Graduates of Dartmouth College—l925 (Including the Class of 1924) Occupation No. Occupation No. Accountant 74 Consular service 9 Agricultural agent 1 Contractor 18 Architect 13 Customs officer Army officer 13 Dentist 15 Artist 2 Diplomat 3 Astronomer 2 Draftsman 3 Athletic director 7 Dramatist 1 Auditor 5 Druggist 2 Author 7 Economist 2 Banking 195 Editor 30 Bookkeeper 3 Educator 37 Botanist 1 Engineer 399 Business 2584 Ethnologist 1 Camp director 1 Farmer 80 Chemist 39 Florist 3 Clerk S Forester 19 Collector Int. Rev. 2 Fruit grower 10 Occupation No. Occupation No. Geologist 3 Physician & surg. 426 Government 19 Planter 1 Health officer 4 Postmaster Historian 1 Printer Hotel manager IS Probation officer 2 Hydrographer 1 Prohibition Dir'ct'r 1 Immigration Insp'r 1 Psychiatrist 1 Insurance 202 Psychologist 2 Internal rev. agt. 3 Publisher 45 Inventor 1 Rancher 11 Journalist 63 Registrar 3 Lawyer 617 Research 3 Lecturer 1 Scientist 1 Librarian IS Sec'y Y.M.C.A. 13 Manufacturer 75 Social service 6 Marine officer 2 Statistician Mechanic 2 Student 226 Minister 184 Supt. lighthouse 1 Missionary 13 Supt. Reformatory 1 Musician 5 Supt. schools 46 Naval officer 6 Teacher 651 Oculist 1 Topographer 1 Organist 1 Veterinary 1 Ornithologist 1 Osteopath 1 6289 Pathologist 4 None stated 276 Pharmacist 1 Philatelist 1 Total 6565
Significant changes in the occupations of the living graduates of 1910 as compared with 1925 are shown in Table IV. Besides the expected increase in absolute numbers and relative importance of business, somewhat surprising tendencies are shown in certain of the professions. The actual numbers of lawyers, ministers, physicians and surgeons have decreased in this time and their relative importance has therefore decreased even more markedly. Certain other classifications "teachers and educators," "journalists, editors, and publishers" and "engineers" have decreased in relative importance although increasing slightly in actual numbers. "Banking" and "insurance" are the only ones which, like general business, increased in both actual numbers and relative importance. The increase in numbers and importance of "other occupations" is due probably as much to the extension of the minor classification as to any broadening of activities of Dartmouth graduates.
TABLE IV
Occupations of the Living Graduates of Dartmouth College 1910 and 192S PercentagesNumbers of TotalOccupation 1910 1925 1910 192S All 4,351 6,565 100.0 100.0 Banking 66 195 1.5 3.0 Business 1,063 2,584 24.5 39.4 Engineer 371 399 8.5 6.1 Farmer 72 80 1.7 1.2 Insurance 49 202 1.2 3.1 Journalist, editor and publisher 97 138 2.3 2.1 Lawyer 700 617 16.1 9.4 Minister 282 184 6.5 2.8 Physician and surg. 540 426 12.4 6.5 Student 171 226 3.9 3.4 Teacher and educator 710 734 16.4 11.2 Other 230 790 5.0 11.8
Some indication of the trends of the past twenty-five years may be obtained by a study of the graduates of that period in groups of five classes each. Table V provides this information, both in actual numbers of men and in percentages showing relative importance. Most outstanding are the increases in "business" and "insurance." Marked decreases have occurred in all the other professions including that of teaching.
TABLE V
Occupations of the Living Graduates of DartmouthCollege by Groups of Glasses 1900-1925 NumbersOccupations 1900-04 1905-09 1910-14 1915-19 1920-21, Total 577 812 1097 1132 1476 Banking 14 28 35 33 50 Business 166 342 531 605 700 Engineer 56 81 71 58 31 Farmer 8 12 9 6 insurance 14 18 48 36 58 Journalist editor and publisher 13 12 16 19 27 Lawyer 74 69 80 79 26 Minister 15 11 24 9 7 Physician and surgeon 66 47 47 75 26 Student 115 219 Teacher and educator 75 109 120 101 89 Other 76 82 115 106 243 PercentagesOccupations 1900-04 1905-09 1910-14 1915-19 1920-21, Total 100.0 100.0 100.0 100.0 100.0 Banking 2.4 3.4 3.2 2.9 3.4 Business 2.88 42.1 48.4 53.4 47.4 Engineer 9.7 10.1 6.5 5.1 2.1 Farmer 1.4 1.5 0.8 0.5 Insurance 2.4 2.2 4.4 3.2 3.9 Journalist, editor and publisher 2.3 1.5 1.5 1.7 1.8 Lawyer 12.8 8.5 7.3 7.0 1.8 Minister 2.6 1.4 2.2 0.8 0.5 Physician and surgeon 11.5 5.8 4.4 6.6 1.8 Student 0.1 0.1 0.4 14.8 Teacher and educator 13.0 13.4 10.9 8.9 6.0 Other 13.1 10.0 10.3 9.5 16.5