THE ECONOMIC CONDITIONS OF DARTMOUTH COLLEGE
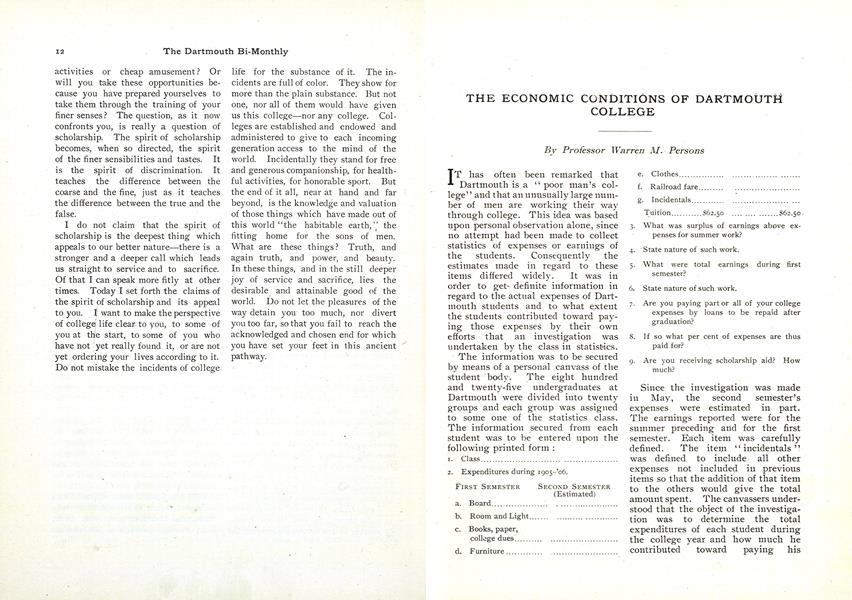
IT has often been remarked that Dartmouth is a “poor man's college” and that an unusually large number of men are working their way through college. This idea was based upon personal observation alone, since no attempt had been made to collect statistics of expenses or earnings of the students. Consequently the estimates made in regard to these items differed widely. It was in order to get definite information in regard to the actual expenses of Dartmouth students and to what extent the students contributed toward paying those expenses by their own efforts that an investigation was undertaken by the class in statistics.
The information was to be secured by means of a personal canvass of the student body. The eight hundred and twenty-five undergraduates at Dartmouth were divided into twenty groups and each group was assigned to some one of the statistics class. The information secured from each student was to be entered upon the following printed form:
1. Class
2. Expenditures during 1905-'06.
FIRST SEMESTER SECOND SEMESTER (Estimated) a. Board.................. ................ b. Room and Light......... ................ c. Books, paper, college dues.............. ................ d. Furniture.............. ................ e. Clothes................ ................ f. Railroad fare.......... ................ g. Incidentals............ ................ Tuition........... $62.50 ...........$62.50
3. What was surplus of earnings above expenses for summer work?
4. State nature of such work.
5. What were total earnings during first semester?
6. State nature of such work.
7. Are you paying part or all of your college expenses by loans to be repaid after graduation?
8. If so what per cent of expenses are thus paid for?
9. Are you receiving scholarship aid? How much?
Since the investigation was made in May, the second semester's expenses were estimated in part. The earnings reported were for the summer preceding and for the first semester. Each item was carefully defined. The item "incidentals" was defined to include all other expenses not included in previous items so that the addition of that item to the others would give the total amount spent. The canvassers understood that the object of the investigation was to determine the total expenditures of each student during the college year and how much he contributed toward paying his expenses by work in college and during the summer. Board and roomrent were to be included in every case whether the student actually paid board and room-rent or received board and room in payment for work. In the latter case the items were to be estimated at the current rate. Six hundred and forty-eight complete schedules were obtained. That is, information concerning seventy-nine per cent of the student body was obtained.
The number of students having expenses in $25 and in $75 groups beginning with $300 was ascertained. The graphic representation showing the distribution of students according to total annual expenses is given in Chart I.
In the graph numbered one the units on the horizontal line represent $25 groups and the height of the broken line above the horizontal corresponds to the number of students having expenses in the different $25 groups. The graph numbered two is obtained by taking $75 groups.
The lowest expense reported was $314.50 and the highest was $1977.00. Both accounts were verified. The man with the lowest expense boarded himself. The two budgets appear below:
BUDGET I
Minimum
1. Class, 1908................
2. Expenditures during 1905-06.
FIRST SEMESTER SECOND SEMESTER (Estimated) a. Board.........$35.00 ..........$35.00 b. Room,Light26.25 ................26.25 c. Books, paper, college dues 14.00 .................6.00 d. Furniture.......0.00 ............0.00 e. Clothes.........8.00 ............7.00 f. Railroadfare10.00 ..............10.00 g. Incidentals...8.00 ..............4.00 Tuition........ 62.50 .............62.50 $163.75 $150-75 Total $314.50
BUDGET II
Maximum
1. Class, 1906........................
2. Expenditures during 1905-’06.
FIRST SEMESTER SECOND SEMESTER (Estimated) a. Board....$106.00 ..............$106.00 b. Room,Light 60.00 ...................60.00 c. Books, paper, college dues 30.00 ....................30.00 d. Furniture...10.00 ..................10.00 e. Clothes....170.00 .................190.00 f. Railroadfare90.00 ..................90.00 g. Incidentals40.00 ..................500.00 Tuition...... 62.50 ...................62.00 $928.50 $1048.50 Total $1977.00
There are more students having expenses in the group $475 to $499 than in any other $25 group. Half of the students have expenses more than $564 and half have less. Ten per cent of the students spent more than $891 during the college year. Table I shows the percentages of students having expenses above stated amount:
TABLE I
90 per cent have expenses over $409 per year80 “ 449 “ 70 “ 488 “ 60 “ 520 “50 “ 564 “40 “ 611 “30 “ 658 “ 20 “ 743 “ 10 “ 891 “ (Tuition of $125 per year is included.)
From a consideration of the statistics given above it appears that a student can easily go through Dartmouth on from $500 to $600 a year. Budget III, which is given below, shows, the expenditure of what might be considered an "average" student:
BUDGET III
Median—(As many having expenses above asthere are having expenses below this amount.)
1. Class, 1908........................
2. Expenditures during 1905-’06.
FIRST SEMESTER SECOND SEMESTER (Estimated) a. Board..... $63.00 .............$63.00 b. Room, light 29.25 ..............29.25 c. Books, paper, college dues..35.00 ................7.00 d. Furniture...15.00 .............._____ e. Clothes......20.00 .............50.00 f. Railroadfare15.00 ..............15.00 g. Incidentals..50.00 .............50.00 Tuition........ 62.50 .............62.50 $289.75 $276.75 Total $566.50
Those reporting earnings for the first semester were put into $10 groups according to the amount of the earnings. Out of six hundred fifty-six students there were two hundred seventy who worked during the semester, or 41 per cent. One hundred fifty-two, or 23 per cent earned more than $50 during the semester, thirty-one men, or 4.7 per cent earned more than $100, twelve men or 1.83 per cent earned more than $150, four men or .61 per cent earned more than $200 and one man earned $400. By far the greater proportion of men having earnings during the semester waited on table or did similar work for their board. (See table II.)
TABLE II
EARNINGS DURING THE FIRST SEMESTERAMOUNT NUMBER Under $10.00 23 $ 10.00 to $39.00 85 40.00 to 69.00 82 70.00 to 99.00 49 100.00 to 129.00 16 130.00 to 159.00 6 160.00 to 189.00 4 190.00 to 199.00 1 220.00 to 229.00 1 250.00 to 259.00 1 350.00 to 359.00 1 400.00 to 409.00 1
In order to determine what portion of their expenses were paid by the men who were wholly or partially paying their way through college the percentage of one-half of summer surplus plus earnings for the first semester to the first semester's expenses was computed. The percentages thus obtained were classified in 3 per cent groups.
The following table shows the result:
TABLE III
39.1 per cent of the students reported no earnings during summer or semester 50 per cent of the students reported earnings above 9 per cent of their semester’s expenses 40 “ “ 15 “ “ 30 “ “ 24 “ “ 20 “ “ 35 “ “ 10 “ “ 50 “ “
Thus it is seen that 10 per cent of the students in College are earning 50 per cent or more of their expenses by work during the summer and college year. Fifteen men earned 75 per cent or more of their expenses and three men earned 115 per cent, 120 per cent, and 140 per cent of their expenses respectively.
The maximum percentage of incidentals to total expenses was 65 per cent. Half of the students had incidental expenses amounting to 11 per cent or more of their total expenses and 10 per cent have incidentals amounting to 28 per cent or more of their expenses.
Scholarships of from $40 to $100 per year are granted to students whose expenses are sufficiently low and whose class standings are sufficiently high. Of the two hundred seventy men who worked during the semester 69 per cent received scholarships, of the three hundred eighty-six who did not work 19 per cent received scholarships and of the total six hundred fifty-six men from whom reports were received upon this point, 39 per cent received scholarships.
Table IV gives the total number of students in each class, the number having scholarships according to the amount and the total number and the percentage in each class having scholarships. Table V gives the statistics of loans made to the students by the College, The data in both of these tables were obtained from the registrar's office and are for the second semester, 1906.
TABLE IV
SCHOLARSHIPS—SECOND SEMESTER, 1906
Class Number in Number having scholarships Total having Per cent having class of the amount denoted scholarships scholarships $20 $25 $30 $35 $50 1906 137 11 25 17 11 - 64 46.7 1907 185 18 35 18 2 6 79 42.7 1908 224 34 30 13 - 1 78 34.8 1909 279 37 52 23 3 4 119 42.7 Totals 825 100 142 71 16 11 340 41.2 One Indian Special receives $62.50
TABLE V
Class Number having loans of the amount denoted $50 $45 $42.50 $40 $37.50 $30 $25 1906 16 1 3 1907 9 1 1 3 1 1908 8 2 1 2 1909 5 1 1 1 1 Total 57, or 6.9 per cent of the student body.
The statistics collected in this investigation are considered to be representative of the student body. Although all of the students did not keep detailed accounts, yet each knew what his total expenses were. Perhaps there is an understatement of expenses of some 5 per cent, the understatement occurring in the "incidentals" item. However, the statistics may be depended upon as showing the economic condition of Dartmouth students.
More From This Issue
-
 Article
ARE THE COLLEGES OF TODAY SUFFICIENTLY HONORING THE CLAIMS OF SCHOLARSHIP?
October 1906 -
 Article
FOOTBALL
October 1906 -
 Article
THE College opened for its one hundred and thirty-seventh year,
October 1906 -
 Article
DARTMOUTH NIGHT DARTMOUTH NIGHT
October 1906 -
 Article
COLLEGE NOTES
October 1906 -
 Article
CHRISTIAN ASSOCIATION
October 1906