THE COLLEGE CENSUS
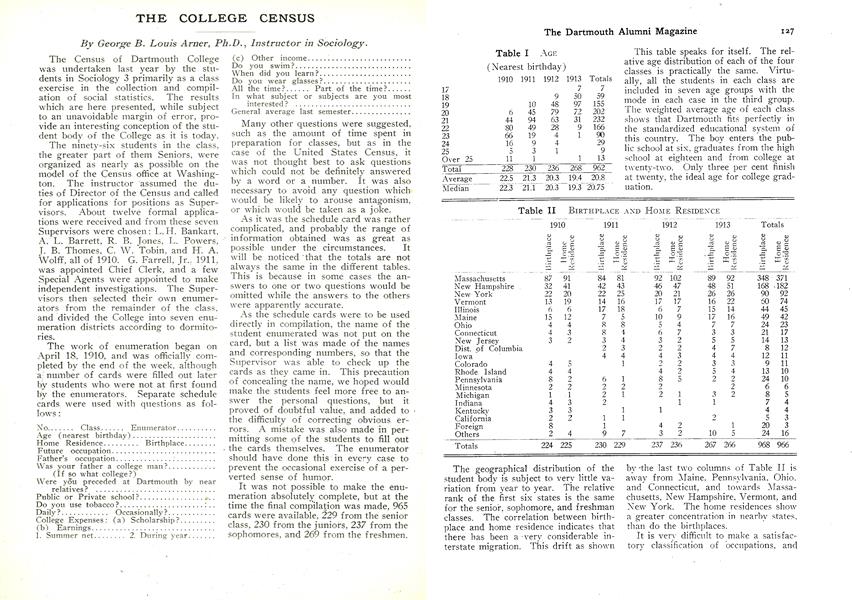
The Census of Dartmouth College was undertaken last year by the students in Sociology 3 primarily as a class exercise in the collection and compilation of social statistics. The results which are here presented, while subject to an unavoidable margin of error, provide an interesting conception of the student body of the College as it is today.
The ninety-six students in the class, the greater part of them Seniors, were organized as nearly as possible on the model of the Census office at Washington. The instructor assumed the duties of Director of the Census and called for applications for positions as Supervisors. About twelve formal applications were received and from these seven Supervisors were chosen: L. H. Bankart, A. L. Barrett, R. B. Jones, L. Powers, T. B. Thomes, C. W. Tobin, and H. A. Wolff, all of 1910. G. Farrell, Jr. 1911, was appointed Chief Clerk, and a few Special Agents were appointed to make independent investigations. The Supervisors then selected their own enumerators from the remainder of the class, and divided the College into seven enumeration districts according to dormitories.
The work of enumeration began on April 18, 1910, and was officially completed by the end of the week, although a number of cards were filled out later by students who were not at first found by the enumerators. Separate schedule cards were used with questions as follows :
No Class Enumerator Age (nearest birthday) Home Residence Birthplace Future occupation Father's occupation Was your father a college man? (If so what college?) Were you preceded at Dartmouth by near relatives? Public or Private school ? Do you use tobacco? Daily? Occasionally? College Expenses: (a) Scholarship? (b) Earnings 1. Summer net. 2. During year. (c) Other income Do you swim? When did you learn? Do you wear glasses? All the time? Part of the time? In what subject or subjects are you most interested ? General average last semester.
Many other questions were suggested, such as the amount of time spent in preparation for classes, but as in the case of the United States Census, it was not thought best to ask questions which could not be definitely answered by a word or a number. It was also necessary to avoid any question which would be likely to arouse antagonism, or which would be taken as a joke.
As it was the schedule card was rather complicated, and probably the range of information obtained was as great as possible under the circumstances. It will be noticed 'that the totals are not always the same in the different tables. This is because in some cases the answers to one or two questions would be omitted while the answers to the others were apparently accurate.
As the schedule cards were to be used directly in compilation, the name of the student enumerated was not put on the card, but a list was made of the names and corresponding numbers, so that the Supervisor was able to check up the cards as they came in. This precaution of concealing the name, we hoped would make the students feel more free to answer the personal questions, but it proved of doubtful value, and added to the difficulty of correcting obvious errors. A mistake was also made in permitting some of the students to fill out the cards themselves. The enumerator should have done this in every case to prevent the occasional exercise of a perverted sense of humor.
It was not possible to make the enumeration absolutely complete, but at the time the final compilation was made, 965 cards were available, 229 from the senior class, 230 from the juniors, 237 from the sophomores, and 269 from the freshmen.
Table I AGE (Nearest birthday) 1910 1911 1912 1913 Totals 17 7 7 18 9 50 59 19 10 48 97 155 20 6 45 79 72 202 21 44 94 63 31 232 22 80 49 28 9 166 23 66 19 4 1 90 24 16 9 4 29 25 5 1 1 1 13 Over 25 11 1 1 Total 228 230 236 268 962 Average 22.5 21.3 20.3 19.4 20.8 Median 22.3 21.1 20.3 19.3 20.75
This table speaks for itself. The relative age distribution of each of the four classes is practically the same. Virtually, all the students in each class are included in seven age groups with the mode in each case in the third group. The weighted average age of each class shows that Dartmouth fits perfectly in the standardized educational system of this country. The boy enters the public school at six, graduates from the high school at eighteen and from college at twenty-two. Only three per cent finish at twenty, the ideal age for college graduation.
Table II BIRTHPLACE AND HOME RESIDENCE 1910 1911 1912 1913 Totals Birthplace Home Residence Birthplace Home Residence Birthplace Home Residence Birthplace Home Residence Birthplace Home Residence Massachusetts 87 91 84 81 92 102 89 92 348 371 New Hampshire 32 41 42 43 46 47 48 51 168 .182 New York 22 20 22 25 20 21 26 26 90 92 Vermont 13 19 14 16 17 17 16 22 60 74 Illinois 6 6 17 18 6 7 15 14 44 45 En 15 12 7 5 10 9 17 16 49 42 Ohio 4 4 8 8 5 4 7 7 24 23 Connecticut 43 8 4 7 3 3 21 17 New Jersey 3 2 3 4 3 2 4 7 8 12 Dist. of Columbia 2 3 2 2 4 7 8 12 Iowa 4 4 4 3 4 4 12 11 Colorado 4 5 1 2 2 3 3 9 11 Rhode Island 4 4 1 2 5 4 13 10 Pennsylvania 8 2 1 8 2 2 10 Minnesota 2 2 2 2 2 2 6 6 Michigan 1 1 2 1 2 1 3 2 8 5 Indiana. 4 3 2 1 1 7 4 Kentucky 3 3 1 1 California 2 2 1 1 2 5 3 Foreign 2 4 9 7 3 2 10 5 24 16 Others 2 4 9 7 3 2 10 5 24 16 Totals 224 225 230 229 237 236 267 266 968 966
The geographical distribution of the student body is subject to very little variation from year to year. The relative rank of the first six states is the same for the senior, sophomore, and freshman classes. The correlation between birthplace and home residence indicates that there has been a very, considerable interstate migration. This drift as shown by the last two columns of Table II is away from Maine, Pennsylvania, Ohio, and Connecticut, and towards Massachusetts, New Hampshire, Vermont, and New York. The home residences show a greater concentration in nearby states, than do the birthplaces.
It is very difficult to make a satisfactory classification of occupations, and the difficulty was further complicated in this case by the desire to correlate the father's occupation with the probable future occupation of the son. It was finally decided to lump all commercial pursuits, including banking and insurance, under the head of business. Manufacturing and transportation were tabulated separately, and under "Domestic and Personal" are included the various callings so classified by the United States Census.
Table III OCCUPATION 1910 19111 1912 1913 Totals Father Son Father Son Father Son Father Son Father Son Agriculture 17 2 17 4 13 1 22 69 Law 14 21 20 27 19 22 26 24 79 94 Ministry 10 5 5 5 8 3 8 3 31 16 Journalism 3 2 4 1 3 3 4 9 10 Education 10 13 8 10 5 9 13 5 36 37 Engineering* 7 27 1 1 2 4 Literary 2 3 1 1 2 4 Public Official 2 2 4 2 2 10 4 18 8 Dentistry 5 1 3 9 Chemistry 7 1 4 3 15 Forestry 5 3 2 2 12 Maufactring 21 9 18 2 17 2 16 2 72 15 Business 89 77 99 62 105 56 108 35 401 230 Transportation 10 1 3 5 1 4 22 2 Artisan 18 19 19 26 82 Domestic and Personal 4 4 5 7 1 20 1 Miscellaneous 4 2 6 2 4 14 4 Totals 229 229 230 230 237 237 269 269 965 965
More than half of the Dartmouth students are the sons of business men, bankers, or manufacturers, with only 151 sons of farmers and artisans. It would be interesting to know how these figures would compare with similar ones from a western state university. In the younger generation more than onethird will probably go into business life, but there is also clearly indicated the attraction of a professional career to a college man. Law, Medicine, and Education show a moderate increase over the older generation; the ministry shows a marked decrease—from 3.3 per cent to 2.7 per cent; but the greatest increase is in the newer professions of engineering and architecture. There are no prospective artisans and but seven prospective agriculturists in the student body,
The question "Was your father a college man? If so what college?" was answered in the affirmative by 241 students or 25 per cent. In some cases, more than one college was named, usually indicating a professional course in addition to the regular college course. In such only the undergraduate college was tabulated. Professional schools were separately tabulated only when no undergraduate college was named. In all 73 colleges were named, the greater number of them represented in the census by but one graduate each. In Table IV only those colleges represented by three or more graduates are separately mentioned.
Table IV FATHERS' COLLEGE College 1910 1911 1912 1913 Totals Dartmouth 15 22 19 24 80 Harvard 3 4 8 1 16 Yale 4 2 2 6 14 Michigan 1 4 3 3 11 Boston Univ. 3 3 1 7 Bowdoin 2 1 3 6 C.C.N. Y. 2 2 1 5 Northwestern 1 1 1 1 4 Union 1 1 1 3 Colby 2 1 3 Middlebury 1 1 1 3 Pennsylvania 2 1 3 Beloit 1 1 1 3 Others 26 14 14 29 83 Totals 59 56 54 72 241 No college 170 174 183 197 724 Totals 229 230 237 269 965 Per Cent 100.0 100.0 100.0 100.0 College 25.8 24:3 22.8 26.8 25.0 No college 74.2 75.7 77.2 73.2 75.0
Table V NEAR RELATIVES AT DARTMOUTH 1910 1911 1912 1913 Totals Yes 45 52 53 61 211 No 184 178 184 208 754 Totals 229 230 237 269 965 Per cent 100.0 100.0 100.0 100.0 Yes 19.7 22.4 22.7 21.9 No 80.3 77.4 77.6 77.3 78.1
Among the influences which guide a prospective student in the choice of a college, one of the strongest is that of family tradition. The hold which Dartmouth has upon the affections of its alumni is clearly shown by the fact that 21.9 per cent of the students now in the College were preceded at Dartmouth by father, grandfather, uncle or brother The influence of the alumni extends, of course, much farther than this - to distant relatives and friends — but it is hardly possible by statistical methods to trace this influence further.
Table VI PUBLIC OR PRIVATE SCHOOL 1910 1911 1912 1913 Totals Public 172 179 170 193 714 Private 55 51 66 75 247 Totals 227 230 236 268 961 Per cent 100.0 100.0 100.0 100.0 100.0 Public 75.8 77.8 72.0 72.0 74.3 Private 24.2 22.2 28.0 28.0 25.7
Dartmouth can never be accused of aristocratic tendencies as long as nearly three-fourths of her students come from the public schools. There is some indication, however, that the relative number of students coming from private schools is on the increase; the figures for 1912 and 1913 greatly exceeding those of 1910 and 1911.
Table VIIDo You USE TOBACCO? 1910 1911 1912 1913 Totals No 47 55 58 98 258 Daily 122 132 120 94 468 Occasionally 59 43 59 77 238 Totals 228 230 237 269 964 Per cent 100.0 100.0 100.0 100.0 100.0 No 20.6 23.9 24.5 36.4 26.8 Daily 53.5 57.4 50.6 34.9 48.5 Occasionally 25.9 18.7 24.9 28.7 24.7
Some of the students have questioned the accuracy of this report which shows that 26.8 per cent of the students do not smoke, but there seems no sufficient reason why it should not be true. However, the steadily dwindling proportion of non-smokers from the freshman to the senior class is significant.
One of the supervisors in urging, the inclusion of this question remarked that if it were shown that a large proportion of the student body could not swim it would be an excellent argument for a swimming pool, while if it revealed the fact that a large number could swim, then we ought to have a swimming pool for their use. The results indicate that both reasons are valid. While 87 per cent can swim, they have no opportunity to do so in Hanover, and practically none learn during their college course, which usually means that those who do not swim, will never learn.
Table VIII Do You SWIM? 1910 1911 1912 1913 Totals No 24 27 29 37 117 Learned before en- tering college 200 198 204 232 834 Learned after en- tering college 3 4 4 11 Totals" 227 229 237 269 962 100.0 100.0 100.0 100.0 100.0 No : iMW11.8 12.2 13.8 12.2 Before 88.1 86.5 86.1 86.2 86.7 After 1.3 1.7 1.7 1.1
Do You WEAR GLASSES? 1910 1911 1912 1913 Totals No 147 143 146 176 612 All of the time 30 31 37 33 131 Part of the time 52 56 53 59 220 Totals 229 230 236 268 963 Per cent 100.0 100.0 100.0 100.0 100.0 No 64.2 62.2 61.9 65.7 63.6 All of the time 13.1 13.5 15.7 12.3 13.6 Part of the time 22.7 24.3 22.4 22.0 22.8 Table IX The amount of defective eyesight among Dartmouth students does not seem to be unusually large. In the New York public schools 31 per cent of the children have defective eyesight, hence, taking age into consideration, the 36.4 per cent in Dartmouth does not seem large. There is certainly no indication that the eyes are injured by overstudy during the college course.
Table X FAVORITE SUBJECTS 1910 1911 1912 1913 Totals No. % No. % No. % No. % No. % Economics 102 250 76 190 31 8.4 24 6.3 233 14.9 English 50 12.0 45 11.2 49 13.2 53 13.9 197 12.6 French 16 3.9 27 6.7 57 15.4 67 17.6 167 10.7 Chemistry 25 6.0 41 10.2 31 8.4 32 8.4 129 8.3 History 28 6.9 44 11.0 32 8.6 23 6.0 127 8.1 Biology 35 8.6 39 9.7 29 7.9 20 5.2 123 7.9 Mathematics 22 5.4 . 18 4.5 24 6.5 43 11.3 107 6.9 German 12 2.9 17 4.2 33 8.9. 43 11.3 105 6.7 Physics 13 3.2 23 5.7 30 8.1 19 5.0 85 5.4 Political Science 24 5.8 24 6.0 7 1.7 2 .5 57 3.7 Sociology 32 7.8 8 2.0 1 .3 2 .5 43 2.8 Graphics 18 4.4 7 1.7 13 3.5 4 1.0 42 2.7 Latin 2 .5 5 1.2 11 3.0 20 5.2 38 2.4 Greek 1 .2 5 1.2 13 3.5 13 3.4 32 2.1 Philosophy 13 3.2 8 2.0 3 .8 4 1.0 28 1.8 Music 4 1.0 2 .5 3 .8 2 .5 11 .7 Italian 9 24 9 .6 Geology 2 .5 4 1.0 6 Fine Arts 4 1.0 2 .5 6 Others 5 1.2 6 1.5 3 .8 1 .3 15 1.0 Totals 408 100.0 401 100.0 370 100.0 381 100.0 1560 100.0
In the compilation of Table X we may perhaps have laid ourselves open to criticism. The question read: "In what subject or subjects are you most interested?" On perhaps half of the cards one subject only is mentioned but on others two, three, and sometimes four subjects are given. Then, in spite of instruction to the contrary, many cards read—"Languages" or "Sciences." It was decided to tally each subject as often "as it was mentioned, and in the case of "Languages" to tally one each for German and French, and "Sciences" one each for Chemistry, Biology, and Physics. "Engineering" was tabulated with Graphics, and "Mineralogy" with Geology.
Perhaps the most significant thing about this table is the increase in favor of the Social Sciences and the corresponding decrease of Languages and Classics during the four years of the college course. Sciences held practically the same relative position throughout the college course.
In the expense accounts of the students there is probably a greater mar- gin of error than in the other items on the schedule card. Few students really know just how much money they spend or just how touch they receive from each of several sources. In making out the schedule it was assumed that the expenditure of practically every student was equivalent to his income from all sources, but it was subsequently found that there were a few students whose income was greater than their expenditure. On the other hand, there were a few cards on which the stated income was obviously insufficient to cover bare necessities. There was also some misunderstanding of the income questions. Under earnings, payments in kind were often difficult to translate into terms of cash. The summer net earnings were, of course, much larger when the student boarded at home than in cases where he had to pay his own current expenses. Then a good many dollars of the earnings, coming directly or indirectly from relatives, should be classified as "Other Income," along with the allowance and other money from home.
But, after all, these errors are most of them unbiased, and tend to cancel one another, and the results as given in Tables XI, XII, XIII, XIV, and XV, are not so inaccurate as to be seriously misleading. The great majority of the men answered the questions in good faith and to the best of their ability.
Table XI SCHOLARSHIP AID 1910 1911 1912 1913 Totals $40 or under 18 22 30 27 97 41-60 50 36 36 31 153 61-80 10 15 17 13 55 81-100 3 2 1 1 7 Over 100 1 1 2 Total Sch'ships 82 76 84 72 314 Without " 144 150 153 192 639 226 226 237 264 953 Per cent 100.0 100.0 100.0 100.0 100.0 With 36.3 33.6 35.4 27.3 32.9 Without 63.7 66.4 64.6 72.7 67.1
The figures in Table XI have been checked, up with the records in the Treasurer's office which shows that out of 1087 students in the four college classes, 367 received scholarship aid. This, gives 33.8 per cent as compared with our 32.9 per cent.
Table XII SUMMER NET EARNINGS 1910 1911 1912 1913 Totals $ 50 or under 27 36 36 30 129 51-100 46 47 56 55 204 101-200 35 30 31 28 124 201-300 4 1 3 5 13 301-500 12 12 6 Total Earning 113 116 127 120 476 Without " 113 110 110 144 477 Totals 226 226 237 264 953 Per cent 100.0 100.0 100.0 100.0 100.0 Earning 50.0 51.3 53.6 45.5 49.9 Not Earning 50.0 48.7 46.4 54.5 50.1
Table XIII EARNINGS DURING ACADEMIC YEAR 1910 1911 1912 1913 Totals $ 50 or under 20 27 36 26 109 51-100 23 35 29 21 108 101-200 45 35 34 23 137 201-300 20 11 3 34 Over 300 12 4 3 3 22 Total Earning 120 112 102 76 410 Without " 106 114 135 188 543 Totals 226 226 237 264 953 Per cent 100.0 100.0 100.0 100.0 100.0 Earning 53.1 49.6 43.0 28.5 43.0 Not Earning 46.9 50.4 57.0 71.5 57.0
Table XIV OTHER INCOME 1910 1911 1912 1913 Totals $ 100 or under 20 10 7 23 60 101-200 19 21 24 13 77 201-300 26 23 26 18 93 301-400 21 17 26 31 95 401-500 28 18 24 30 100 501-600 13 25 34 31 103 601-700 19 26 29 29 103 701-800 23 30 30 45 128 801-900 9 11 13 13 46 901-1000 25 21 11 21 78 1001-1500 13 15 10 8 46 Over 1500 3 1 1 5 Totals 219 218 234 263 934 No other income 7 8 3 1 19 Totals 226 226 237 264 953 Percent 100.0 100.0 100.0 100.0 100.0 With Other Income 96.9 96.5 98.7 99.6 98.0 Without Other Income 3.1 3.5 1.3 .4 2.0
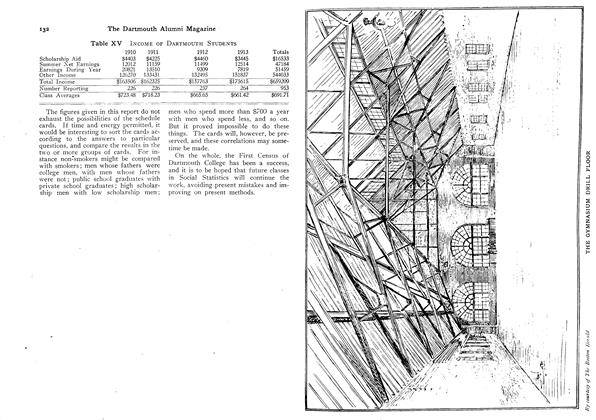
Table XV INCOME OF DARTMOUTH STUDENTS 1910 1911 1912 1913 Totals Scholarship Aid $4403 $4225 $4460 $3445 Summer Net Earnings 12012 11159 7819 51459 Earnings During Year 126270 133431 132495 151837 544033 Other Income 126270 133431 132495 151837 544033 Total Income $163506 $162325 $157763 $175615 $659209 Number Reporting 226 226 237 264 953 Class Averages $723.48 $718.23 $661.42 $691.71
The figures given in this report do not exhaust the possibilities of the schedule cards. If time and energy permitted, it would be interesting to sort the cards according to the answers to particular questions, and compare the results in the two or more groups of cards. For instance non-smokers might be compared with smokers; men whose fathers were college men, with men whose fathers were not; public school graduates with private school graduates; high scholarship men with low scholarship men, men who spend more than $700 a year with men who spend less, and so on. But it proved impossible to do these things. The cards will, however, be preserved, and these correlations may sometime be made.
On the whole, the First Census of Dartmouth College has been a success, and it is to be hoped that future classes in Social Statistics will continue the work, avoiding present mistakes and improving on present .methods.
*Includes Architecture
George B. Louis Arner, Ph.D., Instructor in Sociology.

Article
-
 Article
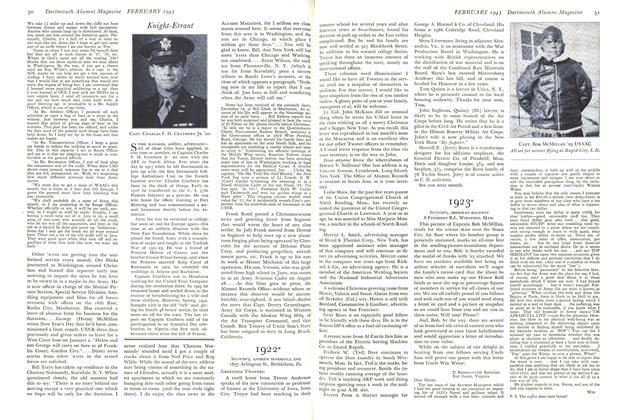
Knight-Errant
February 1943 -
 Article
On the Nose
November 1953 -
 Article
An American Asset in Japan
February 1956 -
 Article
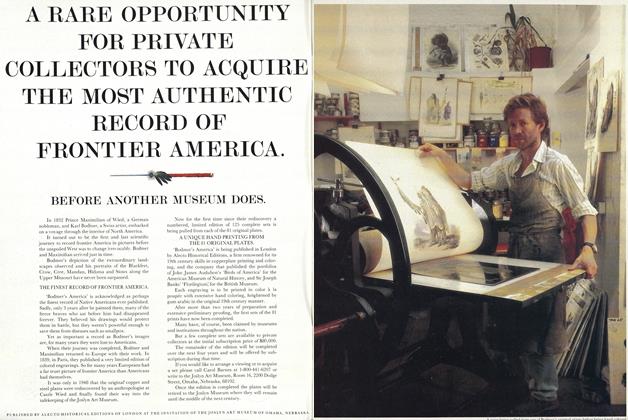
A RARE OPPORTUNITY FOR PRIVATE COLLECTORS TO ACQUIRE THE MOST AUTHENTIC RECORD OF FRONTIER AMERICA.
OCTOBER 1991 -
 Article
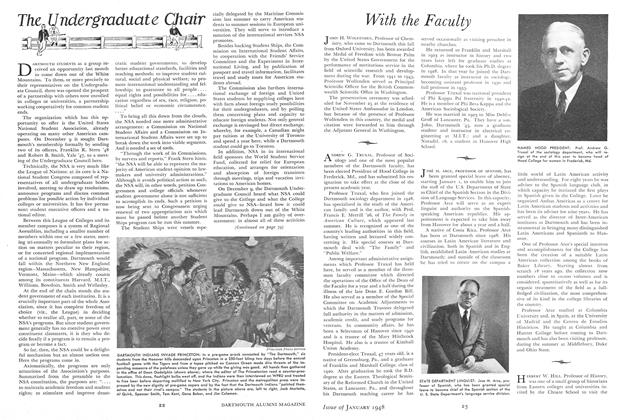
The Undergraduate Chair
January 1948 -
 Article
Timothy Edgar ’94
MAY | JUNE


