FRESHMAN STATISTICS
The following statistics, based on the blanks filled out at matriculation, have been compiled for the freshman class. The distribution by states in order of representation is as follows: Massachusetts 134, New York 77, New Hampshire 54, Illinois 29, Ohio 19, Connecticut 16, lowa 15, New Jersey 14, Vermont 13, Maine 12, Pennsylvania 11, Missouri 7, Minnesota 6, Colorado 6, Michigan 4, Nebraska 4, and sixteen other states with smaller representations. Although New Hampshire shows a gain of five men over last year's class, the home state drops this year for the first time from her long-established second place to third; this is due to York's great advance, the number from that state being double that of last year, Ohio has nearly tripled in numbers, and lowa also shows a startling gain. Vermont alone has lost largely, sending but thirteen men this year as against thirty last year.
Of the 426 new men enrolled, 252. or 59.1 per cent entered without conditions. As always, the majority of the class come from public schools; 287 students prepared for college in public schools, 115 in private schools, and 24 in a combination of both.
As in last year's class, about one-sixth are the sons" of college graduates. Of the fathers, 20 were graduates of Dartmouth, 4 of Columbia, 3 each of Brown and Oberlin, and 2 each of Harvard, Yale, Massachusetts Institute of Technology, New Hampshire State College, New York University, and the University of Vermont. Thirty other colleges and universities are represented by the fathers of members of 1918. Twenty-two mothers of freshmen are college graduates; of these three each are graduates of Cornell and Oberlin.
Over one-sixth of the fathers are engaged in the four learned professions and the allied work of chemistry, journalism, and engineering. Of the rest, 56 are skilled mechanics, 48 clerks and salesmen, 43 manufacturers, 29 bankers and accountants, 21 farmers, 10 contractors, 10 laborers, 9 railroad officials, and 9 government employees.
The tabulation of religious preferences shows the following division: 118 Congregationists, 65 Episcopalians, 51 Presbyterians, 49 Roman Catholics, 35 Baptists, 32 Methodists, 23 Unitarians, 8 Hebrews, 7 Universalists, 21 scattering, and 17 without preference.
More From This Issue
-
 Article
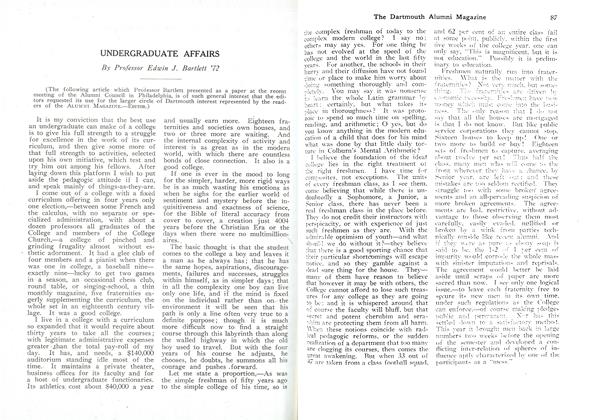
UNDERGRADUATE AFFAIRS
January 1915 -
 Article
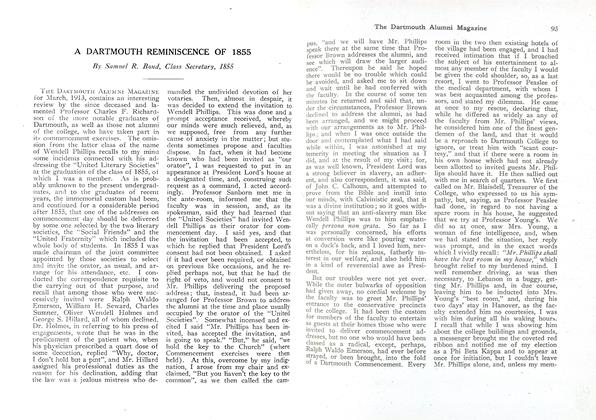
A DARTMOUTH REMINISCENCE OF 1855
January 1915 -
 Class Notes
CLASS OF 1912
January 1915 -
 Article
Dartmouth's November gift to the State of Minnesota—a governor
January 1915 -
 Class Notes
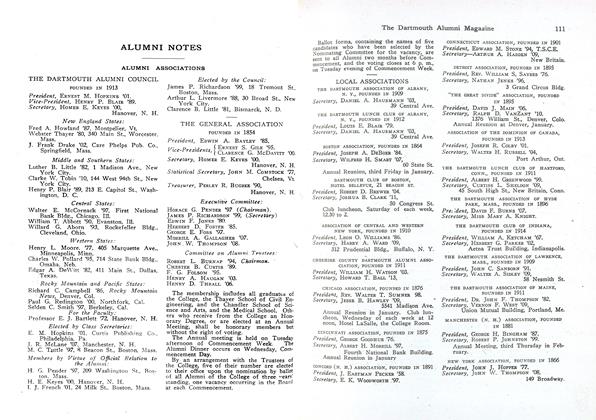
LOCAL ASSOCIATIONS
January 1915 -
 Books
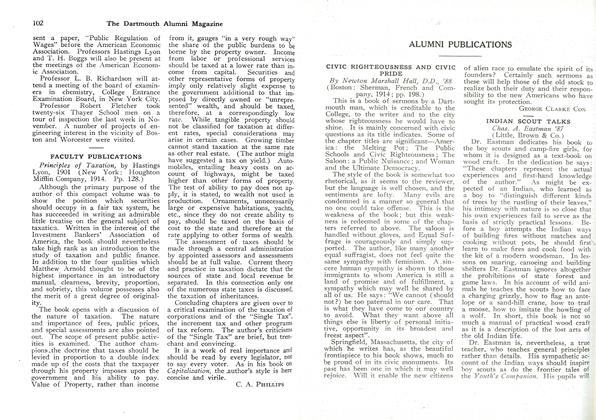
BooksINDIAN SCOUT TALKS
January 1915