STATISTICS OF REGISTRATION
The tendencies toward wider geographical distribution of students noted in the ALUMNI MAGAZINE for December, 1910, are just as evident in the tabulations of the present year. Massachusetts maintains its big lead over other states with New Hampshire still a good second. New York, however, is beginning to challenge for this position, and this year for the first time the number of freshmen from New York exceeds that from New Hampshire, the figures being 59 to 57. The six leaders remain the same as before: Massachusetts, New Hampshire, New York, Vermont, Illinois, and Maine, but the rapid rise of New Jersey, noted last year in these columns, has continued, and this state has now jumped ahead of Ohio into seventh place. Other considerable changes in position are the rise of Michigan from fourteenth to eleventh place, of Colorado from fifteenth to twelfth, and the large proportionate gain of Nebraska.
Of the of the present entering class 76 fathers were college graduates and 16 mothers. This is a smaller number- actually, and proportionately than in the. preceding class. Of these college-bred fathers, but 19 were Dartmouth men as compared with 27 last year. Among the parents, 51 institutions, of higher learning are represented, among them being Canadian, English, and German universities. After Dartmouth those institutions represented by more than two graduates are the University of Michigan, Columbia, Massa- chusetts Institute of Technology, and Boston University. In the present freshman class 71 are the sons of professional men, again" a smaller number than in last year's class. The sons of business men head the list by a large margin, 115 in all, then follow the sons of skilled 52, clerks and salesmen 35, manufacturers 34, auditors and bankers 32, doctors 27, farmers 24, lawyers 22, laborers 15, editors and publishers 12, architects and engineers 9, clergymen 8, teachers 5, and unclassified occupation 12.
The wider constituency of the College is reflected likewise in the church preference expressed by the present freshman class. While Congregationfalists still lead by a large majority, the denominations are much more widely represented than formerly. The list shows the following preferences:
Congregational 137, Episcopal. 49, Catholic 43, Baptist 40, Presbyterian 31, Unitarian 26, Methodist 22, Universalist 13, Hebrew 8, Christian 5, Christian Science 2, Lutheran 1, Quaker 1, Dutch Reformed 1, No Preference 23.
The proportion of those boys who come from high schools is certainly not growing smaller. In the present freshman class 280 prepared, in a high school, 90 in an academy or private school, and 32 had the advantage of both high school and academy.
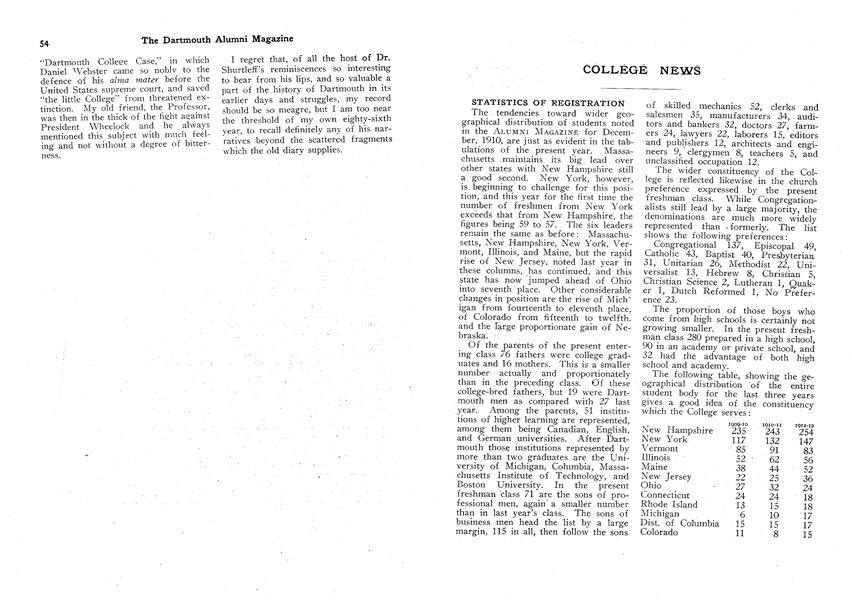
Ihe following table, showing the geographical distribution of the entire student body for the last three years gives a good idea of the constituency which the College serves:
1909-10 1910-11 1911-12 New Hampshire 235 243 254 New York 117 132 147 Vermont 85 91 83 Illinois 52 62 56 Maine 38 44 52 New Jersey 22 25 36 Ohio 27 32 24 Connecticut 24 24 18 Rhode Island 13 15 18 Michigan 6 10 17 Dist. of Columbia 15 15 17 Colorado 11 8 15 Iowa 12 13 13 Pennsylvania 11 14 12 Nebraska 1 3 11 Minnesota 10 8 8 Washington 2 3 6 Indiana 4 2 5 Wisconsin 0 0 4 California 2 3 3 West Virginia 2 2 3 Texas 1 3 3 Maryland 3 3 3 South Dakota 3 4 2 Montana 13 2 Virginia 0 12 Idaho 0 0 2 Egypt 1 1 2 Arizona 0 1 1 Delaware 1 1 1 Florida 2 2 1 Kansas 2 1 1 Kentucky 4 2 1 Missouri 0 0 1 North Dakota 1 1 1 France 1 1 1 Porto Rico 0 1 1 Arkansas 1 1 0 Tennessee 1 1 0 China 0 3 0
More From This Issue
-
 Article
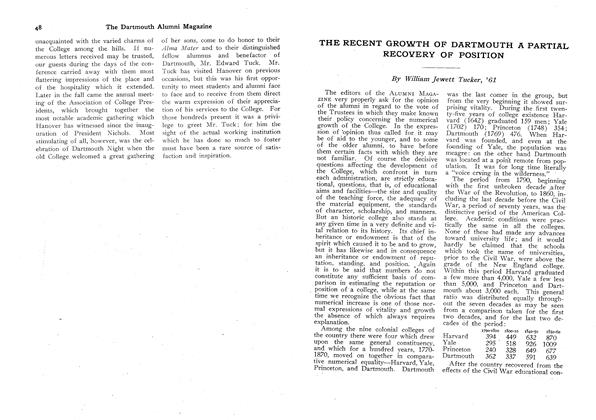
THE RECENT GROWTH OF DARTMOUTH A PARTIAL RECOVERY OF POSITION
December 1911 -
 Article
It is gratifying to note the virtually
December 1911 -
 Article
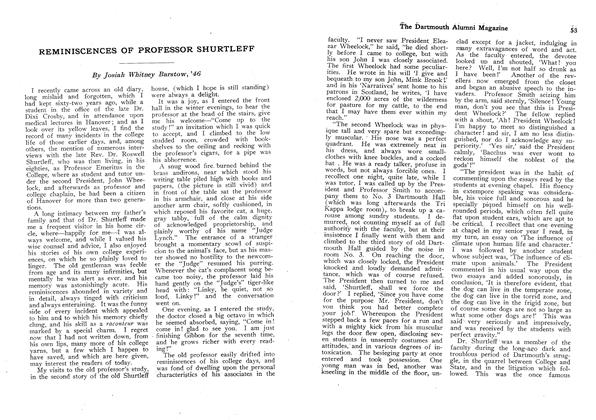
REMINISCENCES OF PROFESSOR SHURTLEFF
December 1911 -
 Article
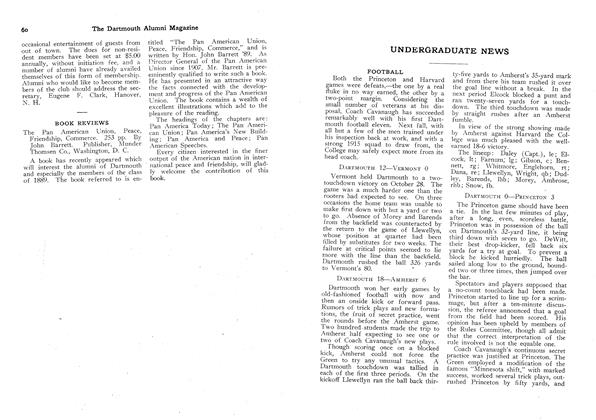
FOOTBALL
December 1911 -
 Class Notes
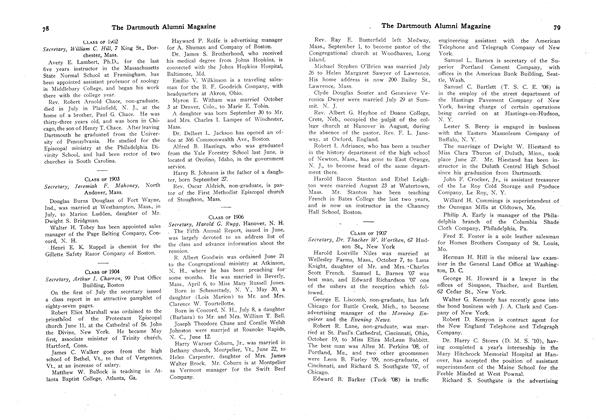
CLASS OF 1907
December 1911 -
 Class Notes
LOCAL ASSOCIATIONS
December 1911