WINTER WEATHER RECORDS AT HANOVER, N. H.
Frequent inquiries for information in regard to the winter weather at Hanover have led to the compilation from the records of Shattuck Observatory of the following tables of temperature and precipitation for the winter months December, January, and February, and snowfall alone for the months November to April inclusive.
The earliest records at the observatory—not included in the following table—are a "thermometrical register" kept by Ebenezer Adams, Jr., from November 1827 to August 1828. It contains thermometer readings made at "morning, noon, and night,' general observa tions on the weather, and an occasional record of the amount of precipitation. From this record the mean temperature for December is found to be 24°, January 26°, and February 32°; giving an average for the three months of 27° The lowest readings recorded are for December—6°, January—B°, and February + 5°. There is practically no indication of the amount of precipitation, but it is evident that the winter of 1827-28 at Hanover, was unusually mild. After 1828 a break of six year occurs in the records which from November 1834 to the present are fairly complete with the exception of precipitation records in the late fifties and early sixties.
Until the fall of 1855 observations were made at a point near where Tuck Hall now stands, but since that date the place of observation has been at Shattuck Observatory. As to the instruments employed, the late Professor Charles A. Young stated shortly before his death that the thermometers used were always of good grade, but that he seriously questioned the correctness of the early records of precipitation, the amount recorded by the rain gauge being, in his opinion, too great.
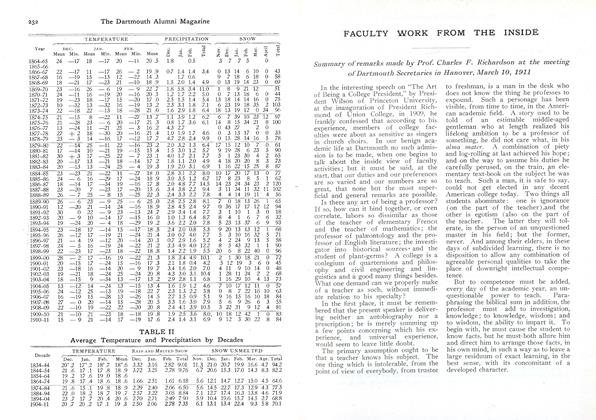
In order to facilitate comparison the information usually desired has been arranged in tables under the headings, temperature and precipitation for the three winter months, and snowfall alone for the months November to April inclusive. Under temperature is given in degrees Fahrenheit, for each winter month indicated at the head of a column the mean and minimum temperatures and also the mean temperature for the winter. As a minimum thermometer was not used until 1857 the lowest readings previous to-that date are not necessarily minimum records. Under precipitation is given in inches for each winter month indicated as before the rain and melted snow combined with totals for the three months, and under snow may be found the total snowfall in inches for each month from November to April with totals for the six months in each case.
Table II contains the average monthly and winter temperature, precipitation (rain and melted snow) and snowfall alone for each decade beginning with 1834 as far as the records allow the determination of such averages.
From table II it might appear that our winter temperatures for the last twenty-five years had been higher than previously, but since 1885 the means have generally been found from maximum and minimum readings rather than from the morning, noon, and night readings, so that the record is not homogeneous. Further than this the uniformity of the average winter temperatures from 1834 to 1884 is due to accidental arrangement of the decades, and cold winters are of recent Occurrence. The low average temperature for the winter of 1903-04 was equaled only in 1872-73 and the records do not show another case of two consecutive winters for which the average temperature was as low as for the winters 1903-04 and 1904-05. It is interesting to note that these low averages follow immediately the decided decrease in the solar radia- tion discovered by the late Professor Langley at the Smithsonian Institution.
The lowest temperature to be found in the records is for the morning of January 24, 1857, when the thermometer recorded —39°.
As to precipitation the records show high averages for the first twenty years of observation not only for winter months but for the entire years. Though this may be real in part, it has already been indicated that Professor Young thought a reduction necessary to make the entire record homogeneous. How much this reduction should be is a question more difficult of answer because of the gap in the observations at the very time when records for comparison should have been kept at both the earlier and later stations. The average winter snowfall was also high during the earlier years and especially so from 1834 to 1844. It should be noted in this connection that estimates of snowfall or the amount of snow on the ground at a given time are at best uncertain During the first decade, however, there are only two records not since equaled. One of these, that for the winter of 1842-43, greatly exceeds the snowfall for any other winter for which we have observations, the other, that for 1843-44, is only slightly in excess. The greatest snowfall for a single month occurred in February 1843. All other monthly records were exceeded in January 1898 and equaled as recently as February, 1910.
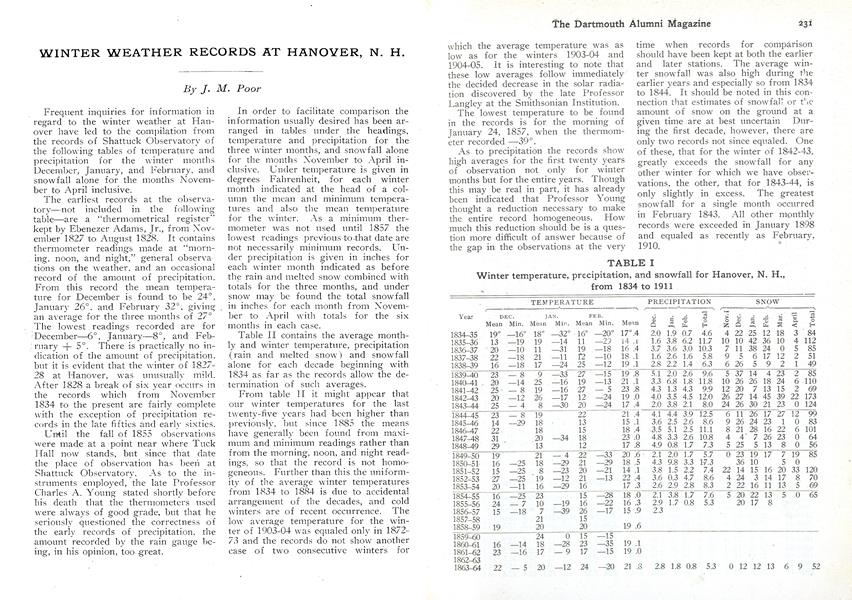
TABLE I
Winter temperature, precipitation, and snowfall for Hanover, N. H.,from 1834 to 1911
TEMPERATURE PRECIPITATION SNOW Year DEC. JAN. FEB. Mean Min. Mean Min. Mean Min. Mean Dec. Jan. Feb. Total Nov. Dec. Jan. Feb Mar. April Total 1834-35 19° -16° 18° —32° 16° —20° 17° .4 2.0 1.9 0.7 4.6 4 22 25 12 18 3 84 1835-36 13 —19 19 —14 11 —29 14 .1 1.6 3.8 6.2 11.7 10 10 42 36 10 4 112 1836-37 20 —10 11 —31 19 —18 16 .4 3.7 3.6 3.0 10.3 7 11 38 24 0 5 85 1837-38 22 -18 21 -11 12 -10 18 .1 1.6 2.6 1.6 5.8 9 5 6 17 12 2 51 1838-39 16 -18 17 -24 25 -12 19 .1 2.8 2.2 1.4 6.3 6 26 5 9 2 1 49 1839-40 23 -8 9 -33 27 —15 19 .8 5.1 2.0 2.6 9.6 5 37 14 423 2 85 1840-41 20 —14 25 -16 19 -13 21 .1 3.3 6.8 1.8 11.8 10 26 26 18 24 6 110 1841-42 25 -8 19 -16 27 - 5 23 .8 4.3 1.3 4.3 9.9 12 20 7 13 15 2 69 1842-43 20 -12 26 -17 12 -24 19 .0 4.0 3.5 4.5 12.0 26 27 14 45 39 22 173 1843-44 25 95 - 4 8 -30 20 -24 17 .4 2.0 3.8 2.1 8.0 24 26 30 21 23 0 124 1844—45 23 - 8 19 22 21 .4 4.1 4.4 3.9 12.5 6 11 26 17 27 12 99 1845-46 14 -29 8 13 15 .1 3.6 2.5 2.6 8.6 9 26 24 23 1 0 83 1846-47 22 18 15 18 .4 3.5 5.1 2.5 11.1 8 21 28 16 22 6 101 1847-48 31 20 -34 18 23 .0 4.8 3.3 2.6 10.8 4 4 7 26 23 0 64 1848-49 29 13 12 17 .8 4.9 0.8 1.7 7.3 5 25 5 13 8 0 56 1849-50 19 21 - 4 22 —33 20 .6 2.1 2.0 1.7 5.7 0 23 19 17 7 19 85 1850—51 16 -25 18 -29 21 -29 18.5 4.3 9.8 3.3 17.3 36 0 5 0 1851-52 15 -25 8 —23 20 —21 14 .1 3.8 1.5 2.2 7.4 22 14 15 16 20 33 120 1852-53 27 -25 19 -12 21 -13 22 .4 3.6 0.3 4.7 8.6 4 24 3 14 17 8 70 1853-54 20 -11 16 -29 16 17 .3 2.6 2.9 2.8 8.3 2 22 16 11 13 5 69 1854-55 16 —25 23 15 —28 18 .0 2.1 3.8 1.7 7.6 5 20 22 13 5 0 65 1855-56 24 - 7 10 —19 16 —22 16 .3 2.9 1.7 0.8 5.3 20 17 8 1856-57 15 —18 7 —39 26 —17 15 .9 2.3 1857-58 21 15 1858-59 19 20 20 19 .6 1859-60 24 0 15 —15 1860-61 16 —14 18 —28 23 —35 19 .1 1861-62 23 —16 17 - 9 17 —15 19 .0 1862-63 1863-64 22 - 5 20 —12 24 —20 21 .3 2.8 1.8 0.8 5.3 0 12 12 13 6 9 52
TEMPERATURE PRECIPITATION SNOW Year DEC. JAN. FEB. Mean Min. Mean Min. Mean Min. Mean Dec. Jan. Feb. Total Nov. Dec. Jan. Feb. Mar. April Total 1864-65 24 —17 18 —17 20 —11 20 .5 1.8 0.5 3 7 7 5 0 1865-66 1866-67 22 —17 11 —17 26 - 2 19 .9 0.7 1.4 1.4 3.4 0 13 14 6 10 0 43 1867-68 16 —19 15 —13 12 —22 14 .3 1.7 0.6 9 7 18 6 18 0 58 1868-69 18 —21 17 —23 21 —10 18 .9 1.5 2.0 1.4 4.9 0 13 19 14 23 0 69 1869-70 23 —16 26 - 6 19 - 9 22.7 1.8 5.8 3.4 11.0 1 8 9 21 12 51 1870-71 24 —11 16 —19 20 —16 20 .1 1.2 1.7 2.2 5.0 0 7 13 18 6 0 44 1871-72 19 —23 18 —17 15 —20 17 .0 2.5 1.5 1.4 5.4 13 18 14 14 16 0 75 1872-73 10 —32 13 —32 16 —19 13 .2 2.3 3.1 1.8 7.1 6 23 19 18 35 2 103 1873-74 22 —18 22 —13 18 —28 21 .0 1.6 2.9 1.8 6.4 18 13 19 12 0 34 96 "1874-75 21 —15 8 —22 11 —27 13 .7 1.1 3.9 1.2 6.2 6 7 39 10 23 12 97 1875-76 21 —28 23 - 6 20 —17 21 .3 0.8 1.7 3.6 6.1 14 8 15 34 21 8 100 1876-77 13 —24 11 —21 25 - 3 16 .2 4.3 2.7 0 43 27 2 0 1877-78 27 + 2 18 —30 20 —16 21 .4 1.0 1.9 1.7 4.6 0 3 13 17 0 0 33 1878-79 23 - 3 14 —16 17 -12 17 .7 4.7 2.8 2.4 9.9 0 15 28 14 16 5 78 1879-80 22 —14 25 —11 22 —16 23 .2 2.0 3.2 1.3 6.4 17 15 12 10 7 0 61 1880-81 17 —14 10 —21 19 —15 15 .4 1.5 3.0 1.2 5.7 9 19 28 6 23 5 90 1881-82 30 + 3 17 —25 22 - 7 23 .1 4.0 1.7 2.1 7.7 5 1 23 30 4 2 65 1882-83 20 —17 13 —21 18 —14 17 .2 1.8 1.1 2.0 4.9 4 18 20 20 8 3 73 1883-84 20 —13 13 —24 25 - 4 19.3 1.9 2.0 3.1 6.9 1 16 22 15 25 8 87 1884-85 23 —23 21 —22 11 —27 18.0 2.8 3.1 2.2 8.0 10 17 20 17 13 0 77 1885-86 24 - 6 16 —29 17 —24 18 .9 3.0 3.5 1.2 6.7 17 8 23 8 5 1 62 1886-87 18 —l4 17 —34 19 —16 17 .8 2.0 4.8 7.7 14.5 14 23 24 34 23 2 120 1887-88 23 —20 7 —23 17 —20 15 .6 3.4 3.8 2.2 9.4 3 11 34 11 32 11 102 1888-89 26 - 7 25 - 8 15 —25 22 .3 2.4 3.3 2.2 7.8 4 4 14 19 11 4 56 1889-90 26 - 6 23 - 9 25 - 6 25 .0 2.8 2.5 2.8 8.1 7 0 18 13 26 1 65 1890-91 12 —20 21 —14 24 —16 18 .9 2.8 4.5 2.4 9.7 0 36 17 17 12 12 94 1891-92 30 0 22 - 9 23 —13 24.7 2.9 3.4 1.4 7.7 3 1 10 1 3 0 18 1892-93 20 - 9 10 —14 17 —15 16 .0 1.0 1.3 6.4 8.7 8 4 1 6 7 6 32 1893-94 19 —24 20 - 4 18 —29 19 .2 3.6 2.2 2.0 7.8 5 23 13 37 6 9 93 1894-95 23 —18 17 —14 15 —17 18 .5 2.4 2.0 0.8 5.3 9 20 13 13 12 1 68 1895-96 26 —12 17 —19 21 —24 21 .4 3.0 0.7 4.0 7.7 5 3 10 16 32 5 71 1896-97 21 - 4 19 —12 20 —14 20 .1 0.7 2.9 1.6 5.2 4 2 24 9 13 5 58 1897-98 24 - 5 16 —19 24 —22 21 .2 3.3 4.9 4.0 12.2 8 5 43 32 1 1 90 1898-99 22 —23 17 —23 18 —22 18 .8 1.4 2.2 1.9 5.5 20 6 8 22 40 0 96 1899-00 28 - 2 17 —16 19 —22 21 .3 1.8 3.4 4.9 10.1 2 1 30 18 21 0 72 1900-01 20 —15 17 —24 15 —16 17 .3 2.1 1.8 0.4 4.2 5 12 19 3 6 0 45 1901-02 23 —18 16 —14 20 - 9 19 .7 3.4 1.6 2.0 7.0 4 11 9 10 14 0 48 1902-03 19 —21 18 —24 25 —24 20 .8 4.3 3.0 3.1 10.4 1 28 11 24 2 2 68 1903-04 18 —15 9 —34 13 —17 13 .2 2.9 2.8 1.1 6.8 1 16 29 10 4 13 73 1904-05 13 —12 14 —24 13 —15 13 .4 1.6 1.9 1.2 4.6 7 10 17 12 11 0 57 1905-06 24 —12 25 —13 19 —18 22 .7 2.3 1.3 2.2 5.8 0 8 7 22 16 10 63 1906-07 16 —19 15 —28 13 —26 14 .5 2.7 1.5 0.9 5.1 9 16 15 16 10 18 84 1907-08 27 - 0 20 —14 15 —28 20 .5 3.3 1.6 3.0 7.9 5 6 9 26 6 3 55 1908-09 22 —10 19 —22 22 —20 20 .8 2.4 4.1 3-9 10.5 3 22 31 9 12 4 81 1909-10 21 —10 21 —23 18 —18 19 .8 1.9 2.5 3.6 8.0. 10 18 12 42 1 0 83 1910-11 15 - 9 21 —14 17 -19 17 .6 2.4 1.4 3.1 6.9 9 12 3 30 22 8 84
TABLE II
Average Temperature and Precipitation by Decades
TEMPERATURE RAIN AND MELTED SNOW SNOW UNMELTF.D 'l)ec. Jan. Feb. Mean Dec. Jan. Feb. Total Nov. Dec. Jan. Feb. Mar. Apr. Total 1834-44 20°.2 17°.2 . 18°.7 18°.6 3.32 3.16 2.82 9.01 11.3 21.0 20.7 19.9 16.6 4.7 94.2 1844—54 21 .6 17 .1 17 .8 18 .9 3.72 3.25 2.78 9.76 6.7 20.6 15.3 17.0 14.3 8.3 82.2 1854-64 19 .2 17 .6 19 .0 18 .6 1864-74 19 .8 17 .4 18 .6 18 .6 1.66 2.51 1.61 6.18 5.6 12.1 14.7 12,7 15.0 4.5 64.6 1874-84 21 -.6 15 .1 19 .8 18 .9 2.29 2.40 2.06 6.50 5.6 .14.5 22.7 17.3-12.9 4 3 77.3 1884-94 22.0 18.2 18.7 19.7 2.57 3.22 3.05 8.84 7.1 12.7 17.4 16.3 13.8 4.6 71.9 1894-04 23 . 7 17 .7 20 .4 20 .6 270 2.71 2:49 7.90 5.9 10.4 19.6 15.7 14.5 2.7 68.8 1904-11 20 . 7 20.2 17.1 19.3 2.50 2.06 2.78 7.35 6.1 13.1 13.4 22.4 9.3 5 8 70.1