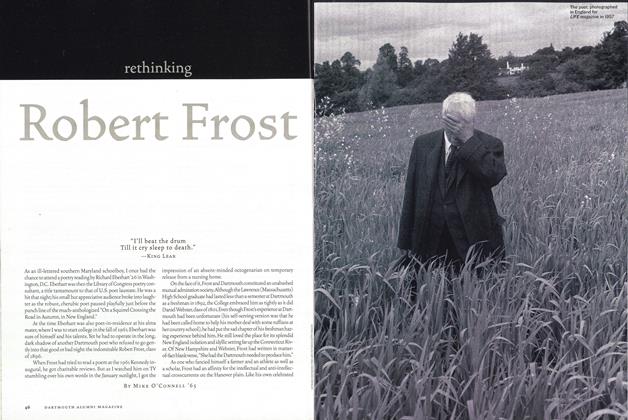
Project IMPRESS
An innovative computer study in the social sciences
How does race affect income? Did Eugene McCarthy have only liberal backing or did his support come from a wider political spectrum? Is there any correlation between one's religion and the size of town or city in which one lives? Are men or women more apt to be in favor of using non-violent methods to solve special problems?
These and many similar questions are being asked, answered and analyzed by today's Dartmouth students as a result of a unique approach to survey analysis. An innovative computer system for social science research and education, using the extensive resources and facilities of the Dartmouth time-sharing system, is being enthusiastically used by undergraduates and faculty.
Project IMPRESS (Interdisciplinary Machine Processing for Research and Education in the .Social Sciences), supported by the Carnegie Corporation of New York, the Alfred P. Sloan Foundation, and the National Science Foundation, is the result of a proposal formulated two years ago by Professors James Davis, John Kemeny, Edmund Meyers, Franklin Smallwood, and Denis Sullivan.
The feeling of this group was that a computer package which would have both pedagogical and research value for social scientists could be incorporated into our existing time-sharing system. After funds were secured, a relatively simple IMPRESS file was put together in the summer of 1968 to demonstrate technical feasibility and to illustrate how a more elaborate system could be used in the future. Initial growing pains were inevitable, but by the fall term of 1969, students were using IMPRESS for both course work and independent research.
Perhaps IMPRESS'S unique feature is that it is geared to the undergraduate, who more often than not is a relatively unsophisticated computer user. While other colleges and universities maintain computerized social science data banks, the level of sophistication necessary to retrieve and analyze this information is necessarily high, and while it assures the graduate student and faculty member a research source, it all but closes the door to the undergraduate.
IMPRESS has been designed to be used in introductory (as well as upperlevel) social science courses by students who have in most instances never operated a teletype, or acquired computer programming skills. To break the student out of the textbook-lecture-exam syndrome, he is taught, through a series of simple exercises, (1) how to operate the IMPRESS system, (2) how to choose data which the package can handle, and (3) how to analyze the results.
At first these exercises are merely a means of acquainting the student with the general terminology of the system and use of the teletype. Gradually as he becomes more skillful with the machine itself and the material he is using, he learns to manipulate the data for the purposes of carrying out more sophisticated exercises. What may actually emerge at this point is new and perhaps exciting information.
When the undergraduate reads in a text that there is a correlation between high personal income and greater educational attainment, conversely that those people with lower incomes are not so well educated, he may glance at the graph or chart depicting this non-surprising fact, accept it at face value because it appears to be logical and move on to the next page. But the student who is IMPRESS-oriented is able to challenge such statements and check the validity of the correlation himself.
By dichotomizing the variables education and income into groups other than those created by the author, he may very well get an entirely different correlation. He will know why the association has changed because he himself has mapped the variables.
Once he has gained the skills necessary for using IMPRESS files, he will then move on to analyzing the data which the computer gives him, perhaps ultimately challenging the professor in his course. He becomes excited with unexpected results (or non-results) be- cause he is actively involved in the exercise. By the end of the ten-week term, he is off and running on his own independent research project, feeding the computer data he has manipulated himself and analyzing his own results. He can then say, "I found these results from handling the data this way," rather than, "I read in the text that thus and so is true."
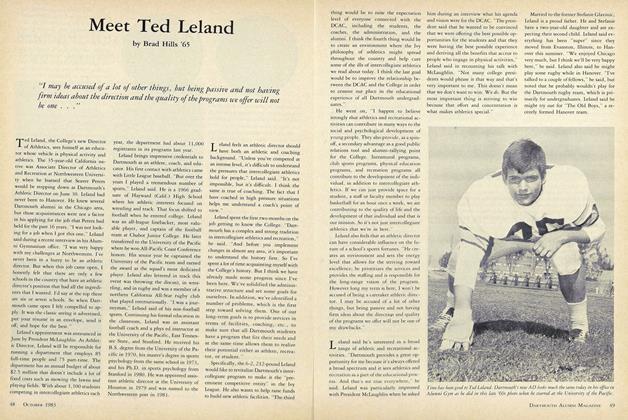
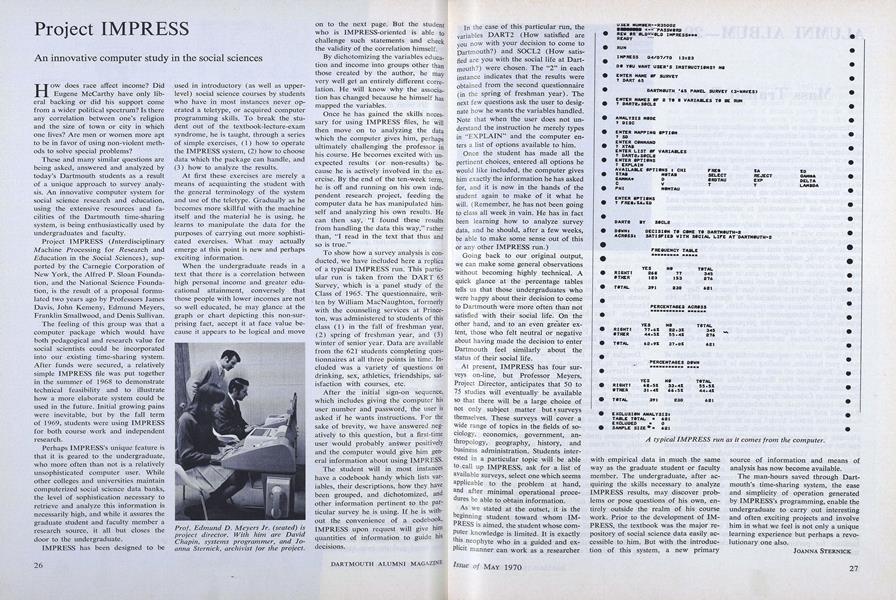
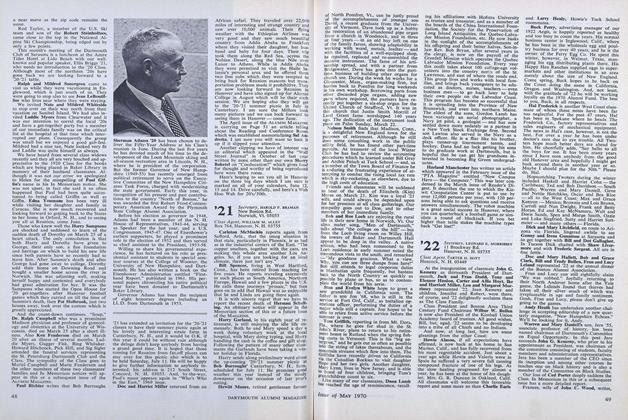
To show how a survey analysis is conducted, we have included here a replica of a typical IMPRESS run. This particular run is taken from the DART 65 Survey, which is a panel study of the Class of 1965. The questionnaire, written by William MacNaughton, formerly with the counseling services at Princeton, was administered to students of this class (1) in the fall of freshman year, (2) spring of freshman year, and (3) winter of senior year. Data are available from the 621 students completing questionnaires at all three points in time. Included was a variety of questions on drinking, sex, athletics, friendships, satisfaction with courses, etc.
After the initial sign-on sequence, which includes giving the computer his user number and password, the user is asked if he wants instructions. For the sake of brevity, we have answered negatively to this question, but a first-time user would probably answer positively and the computer would give him general information about using IMPRESS.
The student will in most instances have a codebook handy which lists variables, their descriptions, how they have been grouped, and dichotomized, arid other information pertinent to the particular survey he is using. If he is without the convenience of a codebook, IMPRESS upon request will give him quantities of information to guide his decisions.
In the case of this particular run, the variables DART2 (How satisfied are you now with your decision to come to Dartmouth?) and SOCL2 (How satisfied are you with the social life at Dartmouth?) were chosen. The "2" in each instance indicates that the results were obtained from the second questionnaire (in the spring of freshman year). The next few questions ask the user to designate how he wants the variables handled. Note that when the user does not understand the instruction he merely types in "EXPLAIN" and the computer enters a list of options available to him.
Once the student has made all the pertinent choices, entered all options he would like included, the computer gives him exactly the information he has asked for, and it is now in the hands of the student again to make of it what he will. (Remember, he has not been going to class all week in vain. He has in fact been learning how to analyze survey data, and he should, after a few weeks, be able to make some sense out of this or any other IMPRESS run.)
Going back to our original output, we can make some general observations without becoming highly technical. A quick glance at the percentage tables tells us that those undergraduates who were happy about their decision to come to Dartmouth were more often than not satisfied with their social life. On the other hand, and to an even greater extent, those who felt neutral or negative about having made the decision to enter Dartmouth feel similarly about the status of their social life.
At present, IMPRESS has four surveys on-line, but Professor Meyers, Project Director, anticipates that 50 to 75 studies will eventually- be available so that there will be a large choice of not only subject matter but surveys themselves. These surveys will cover a wide range of topics in the fields of sociology, economics, government, an- thropology, geography, history, and business administration. Students interested in a particular topic will be able to call up IMPRESS, ask for a list of available surveys, select one which seems applicable to the problem at hand, and after minimal operational procedures be able to obtain information.
As we stated at the outset, it is the beginning student toward whom IMPRESS is aimed, the student whose computer knowledge is limited. It is exactly this neophyte who in a guided and explicit manner can work as a researcher with empirical data in much the same way as the graduate student or faculty member. The undergraduate, after acquiring the skills necessary to analyze IMPRESS results, may discover problems or pose questions of his own, entirely outside the realm of his course work. Prior to the development of IMPRESS, the textbook was the major repository of social science data easily accessible to him. But with the introduction of this system, a new primary source of information and means of analysis has now become available.
The man-hours saved through Dartmouth's time-sharing system, the ease and simplicity of operation generated by IMPRESS'S programming, enable the undergraduate to carry out interesting and often exciting projects and involve him in what we feel is not only a unique learning experience but perhaps a revolutionary one also.
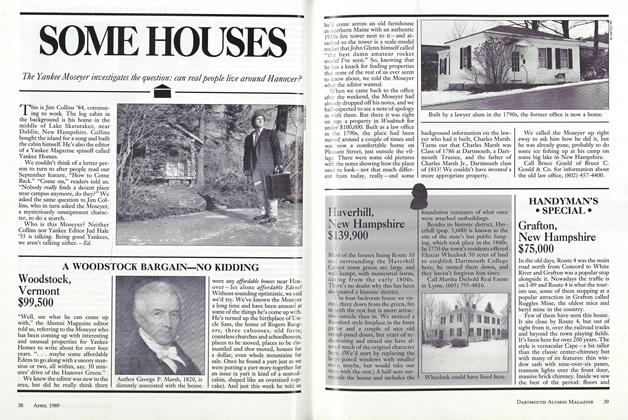
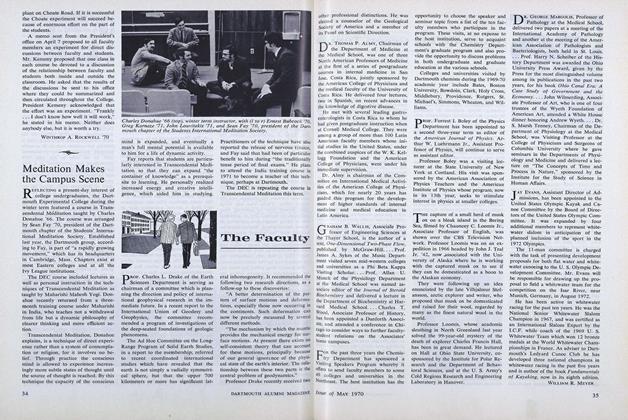
Prof. Edmund D. Meyers Jr. (seated) isproject director. With him are DavidChapin, systems programmer, and Joanna Sternick, archivist for the project.
A typical IMPRESS run as it comes from the computer.
More From This Issue
-
 Feature
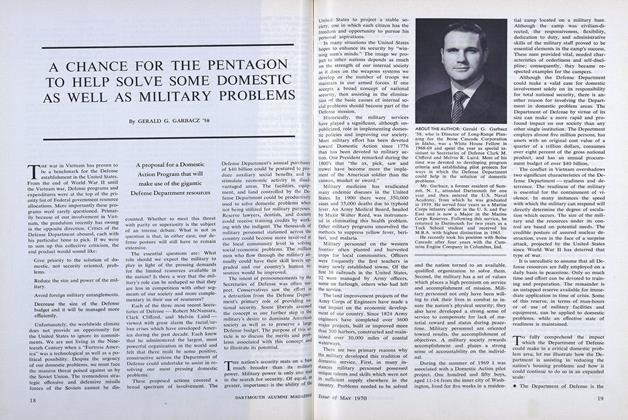
A CHANCE FOR THE PENTAGON TO HELP SOLVE SOME DOMESTIC AS WELL AS MILITARY PROBLEMS
May 1970 -
 Feature
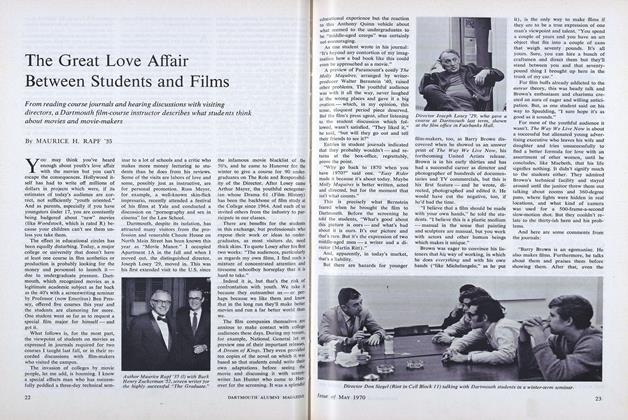
The Great Love Affair Between Students and Films
May 1970 -
 Feature
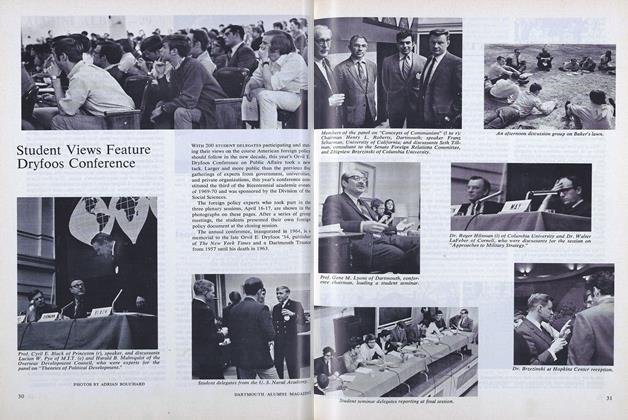
Student Views Feature Dryfoos Conference
May 1970 -
 Article
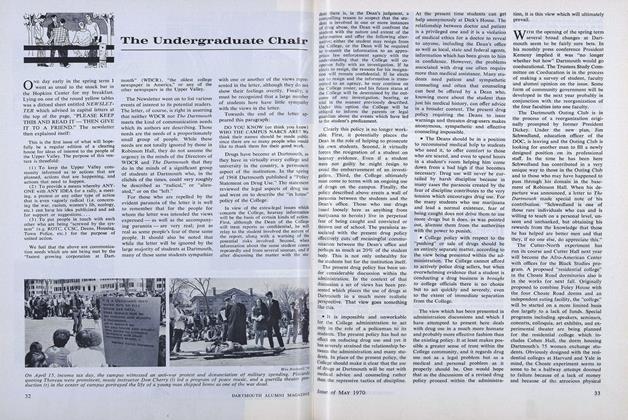
The Undergraduate Chair
May 1970 -
 Article
The Faculty
May 1970 -
 Class Notes
1921
May 1970