The Rating Game
LATER THIS SUMMER U.S. News & World Report will release its annual rankings of colleges and universities. Soon thereafter presidents of various institutions of higher ed will celebrate—or bemoan—the results.
Today college-ranking surveys are as common as Facebook accounts. But in 1983, when U.S. News first released its version, the idea of comparing post-secondary schools by assigning numerical values to often abstract qualities was novel. It was also somewhat
controversial, not necessarily among Harvard, Yale and Princeton, which always seem to win, place or show, but among schools whose rank danced around from one year to the next. The magazine claimed its methodologies changed, forcing adjustments, but that explanation hasn't always mollified angry admissions officers.
For its part, Dartmouth has finished better than 10th place in 23 of the 25 years the U.S. News survey has been published, with an average ranking of 8.5. The College's high-water mark—sixth place—came in 1987, and its lowest—11th place—came in 1999 and again last year, when Dartmouth finished behind all the Ivies except Brown.
How are the rankings calculated? One factor is what other school heads think of you. While this "peer assessment," as the magazine calls it, is no longer the only factor considered (as it was prior to 1987), it counts for 25 percent of the total.
Bob Morse, a data researcher at the magazine, says peer-grading works like this: A survey is mailed to the president, provost and head of admissions at each of the 262 schools in the survey's "national university" catego ty. Each rates Dartmouth's strength on a scale of 1 to 5, mails it back in and the numbers are averaged.
"But typically they rate only about half of the schools on the survey," Morse says. "Very few rate all the schools."
The result? Last year Dartmouth's favorability was 4.3 out of 5, just below the 4.4 it's clocked for much of the last decade. Through the years Dartmouth's peer assessment has been lower than most other Ivy schools and lower than that of many universities that receive a lower overall ranking than Dartmouth.
President Jim Wright has never been a fan of this element, and he even met with U.S. News editors a few years back to air his concerns. "I'm troubled by their rankings and have always been troubled by the way the magazine tries to reduce quality experience to a few simple metrics," he says. "They report total budget, not necessarily what's being spent on undergraduates. The student-to-faculty ratio also doesn't represent whether professors are teaching undergraduates." The peer assessments, he adds, become based on reputation. "And for most rankings based on reputation, the size of the graduate programs becomes a factor," he says.
It all presents such a distorted picture that Wright says he's contemplating not participating when the magazine asks him in the future for his views on other schools. "We'll continue to provide them with information about the College, as we do other publications," he says. Stay tuned to see how U.S. News evolves and reacts to this and other criticisms of its rankings.
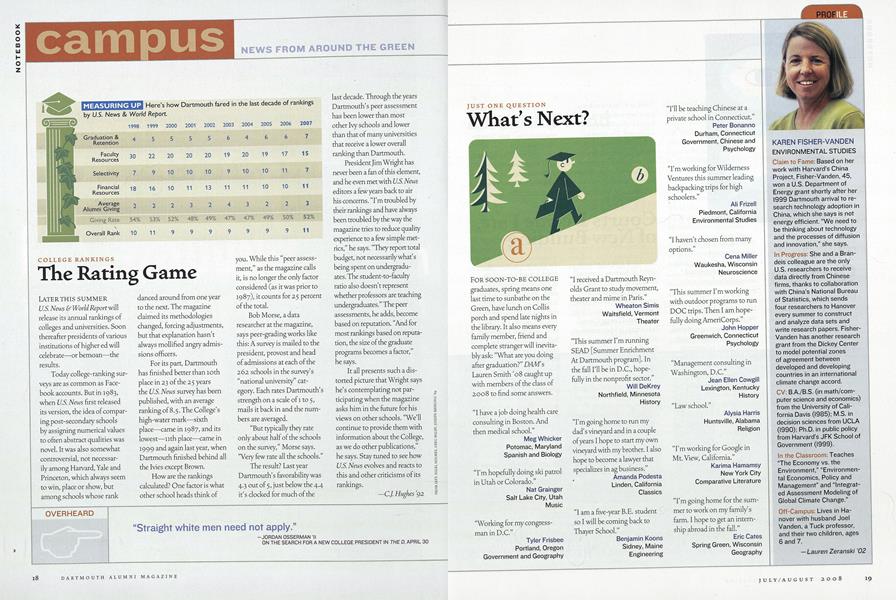
MEASURING UP Here's how Dartmouth fared in the last decade of rankings by U.S. News & World Report. 1998 1999 2000 2001 2002 2003 2004 2005 2006 2007 Graduation & Retention 4 5 5 5 5 6 4 6 6 7 Faculty Resources 30222020201920191715 Selectivity 7910 10 10 9101011 7 Financial Resources 18 16 101113 11 11 10 10 11 Average Alumni Giving 222 3 2 4 32 2 3 Giving Rate 54% 53% 52% 48% 49% 47% 47% 49% 50%52% Overall Rank 10 119999999 11
OVERHEARD
"Straight white men need not apply." -JORDAN OSSERMAN '11 ON THE SEARCH FOR A NEW COLLEGE PRESIDENT IN THE D, APRIL 30


Article
-
 Article
THE ORIGINS OF DELTA ALPHA—A SYMPOSIUM
March, 1923 -
 Article
Masthead
JULY 1963 -
 Article
Psychology Ph.D. Launched
DECEMBER 1968 -
 Article
Graduate Study Grants Available to Alumni
DECEMBER 1971 -
 Article
Statement by the Board of Trustees
February 1976 -
 Article
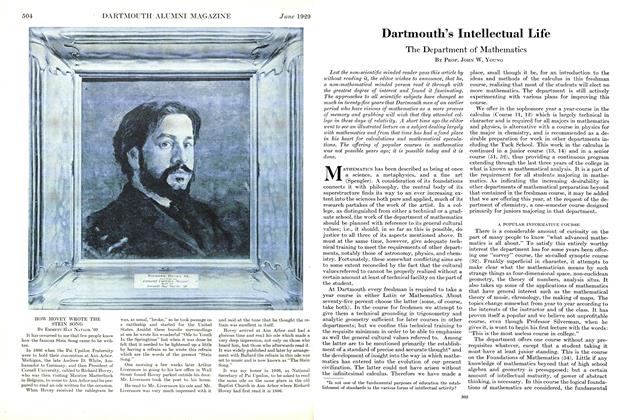
HOW HOVEY WROTE the STEIN SONG
June 1929
