FRATERNITIES AND SCHOLARSHIP
The following figures, with statements accompanying them, have been compiled at the request of the Alumni Magazine, and will perhaps be of interest to those who are collecting data concerning present day college life and conditions affecting it.
The average scholarship of each class and of the entire College for the first semester of the present year, the comparative standing of fraternity and nonfraternity men, the percentage of the student body belonging to fraternities, and the comparative scholarship standing of the different fraternities are here given with no attempt to draw conclusions or inferences. So many explanations might be given for the variations in the figures that it seems best merely to state the results and explain the meanings of the different tables.
I. The average scholarship for the entire College for the first semester of this year was found to be 70.6%. Fortunately figures are available showing the average scholarship of the College for four different years separated from each other by periods of five years. The table given below shows the average scholarship of each, class and of the College for the years 1888-89, 1893-94, 1898-99, 1903-04, and for the first semester of 1909-10; Sen. Jun. Soph. Fresh. Col. 1888-89 80.4 81.3 77.5 76.3 78.9 1893-94 79.1 80.2 78,0 74.2 = 77.6 1898-99 74.1 75.2 73.5 73.1 = 73.9 1903-04 75.6 73.4 69.6 72.1 = 72.3 1909-10 76.9 71.7 68.9 66.3 = 70.6
An examination of the table will show a steady drop in the average scholarship of the College, the greatest drop coming in the second period, coincident with the introduction of a freer system of elec- tives after freshman year. This would seem to confirm the contention of many teachers that the elective system is re- sponsible to a considerable degree for the lowering of the grade of scholarship be- cause of the tendency of the highest rank men to elect small advanced courses and so remove the stimulus of their presence and example to the average student in the largely elected courses.
The drop in the last period is in reality not so large as is shown by the figures. Up to and including the year 1903-04 the average standing of a student was as- certained by combining the marks m the courses passed, not taking into consider- ation the courses failed. This was an inheritance from the system of required courses, when all failed courses had to be repeated and a mark in a course counted only when passed. The average standing is now made up on the basis of fifteen hours whether the courses are passed or failed. This fact would make the drop of 1.7% somewhat smaller, but it does not explain all of the loss.
11. The next table shows the com- parative standing of fraternity and non- fraternity men by classes and College. As expected the non-fraternity men show a higher standing, the difference being 4.66% : Sen. Jun. Soph. Fresh. Col. Fraternity 75.6 69.8 67.5 64.0 —68.87 Non-Frat. 78.9 76.1 71.5 69.8 =73.53
111. The table showing the propor- tion of the student body belonging to fra- ternities gave the most surprising results in the investigation. From the numbers given out each year on “Chinning Day," we have grown accustomed to think that about fifty per cent of the students were members of fraternities. The figures given below, which were obtained from the current-Augis supplemented by addi- tions from The Dartmouth, show that 62j4% of the students are members of fraternities: Sen. Jun. Soph. Fresh. Fraternity 151 162 168 180—661 (62 yi%) Xon-Frat. 94 69 116 117=396 ( 37yi%)
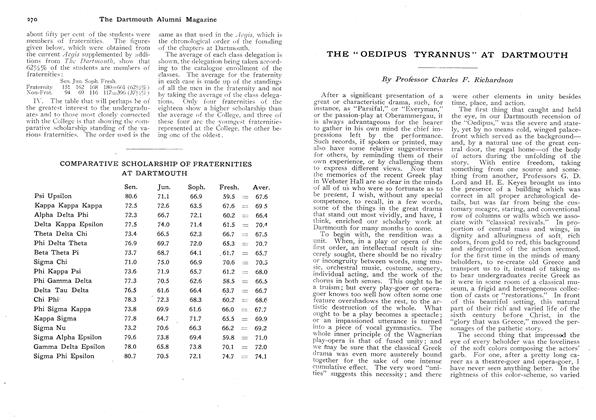
I\ . The table that will perhaps be of the greatest interest to the undergradu- ates and to those most closely connected with the College is that showing the com- parative scholarship standing of the va- rious fraternities. The order used is the same as that used in the Aegis, which is the chronological order of the founding of the chapters at Dartmouth.
The average of each class delegation is shown, the delegation being taken accord- ing to the catalogue enrollment of the classes. The average for the fraternit}" in each case is made up of the standings of all the men in the fraternity and not by taking the average of the class delega- tions. Only four fraternities of the eighteen show a higher scholarship than the average of the College, and three of these four arc the youngest fraternities represented at the College, the other be- ing one of the oldest.