THE DARTMOUTH S. A. T. C. AND THE ARMY INTELLIGENCE TESTS
Without attempting to estimate the practical value of the Army Intelligence Tests, or to pass judgment on Uncle Sam's method of sifting "officer material," a study of the results obtained from the tests in the Students' Army Training Corps at Dartmouth proves most satisfactory as well as interesting.
The tests were given to 595 men in the S. A. T. C. and the Naval Unit, under the supervision of the Department of Psychology. No men less than 18 years of age were tested. Of the 595 tested — 420, or 71.6% scored A; 142, or 24% scored B; 32, or 5% scored C plus; only one man scored less than C plus (receiving C because he failed to complete his tests). The average for the entire body was 155 points, or 20 points above the minimum mark required for A in the Army.
The War Department at Washington furnished the Department of Psychology with a pamphlet giving the results of the Army tests in cantonments, in special groups in service, in vocational groups and in other units. In drawing comparisons with these figures the significance of the results obtained at Dartmouth is best shown. The comparisons made are demonstrated in the series of charts which follow.
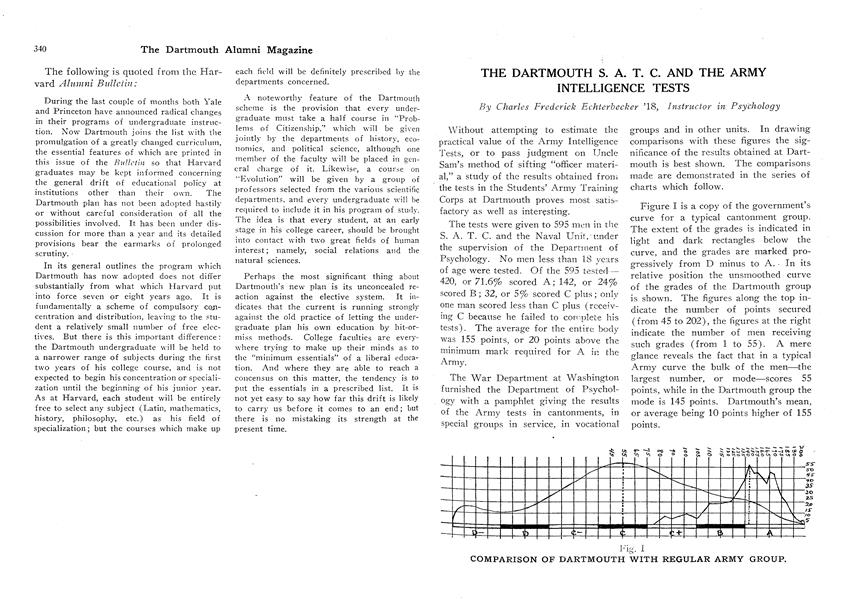
Figure I is a copy of the government's curve for a typical cantonment group. The extent of the grades is indicated in light and dark rectangles below the curve, and the grades are marked progressively from D minus to A. In its relative position the unsmoothed curve of the grades of the Dartmouth group is shown. The figures along the top indicate the number of points secured (from 45 to 202), the figures at the right indicate the number of men receiving such grades (from 1 to 55). A mere glance reveals the fact that in a typical Army curve the bulk of the men—the
largest number, or mode—scores 55 points, while in the Dartmouth group the mode is 145 points. Dartmouth's mean, or average being 10 points higher of 155 points.
Figure II shows a comparison, not with a cantonment group as a whole, but with picked men in the officer training detachments of 5 of the largest cantonments. In this figure Dartmouth stands first with 71.6% A, 24% B and 5% C plus. Camp Devens stands second with 62.4% A, 22.6% B, 12% C plus, and in addition, nearly 4% below C plus. Camp Lewis is shown second on the chart, not because it ranks next to Dartmouth but because it has the smallest percentage below C plus.
Figure III affords a comparison from a different angle, not in this case a group of men in training but a group of officers who have passed their training stage and have gone into actual service. In this group Dartmouth stands second, being outranked only by the Engineer Officers, and that exception due probably to technical skill gained by the engineers in practice. In these tests, the Engineer officers attained a proportion of 79% A, 17% B, and 4% C plus. Dartmouth's record is 71.6% A, 24% B, and 5% C plus. The writer of the government pamphlet draws particular attention to "the remarkably high ratings of Engineer Officers." Dartmouth stands next, with the Field Artillery Officers third, carrying more than 3% of men below C plus grade.
Figure IV shows a comparison of the Dartmouth group with the 12 most intelligent vocational groups in the government service. In this figure, the heavy horizontal bar marks the extent of the middle 50% of the scores of each group. The short vertical bar indicates the median for each group. It will be noticed that the Engineer Officers again rank first from the technical standpoint, their median falling farthest up into the A section, and Dartmouth is again second with its median slightly to the left of that of the Engineers. Only one other occupational group (the Army Chaplains) has its median in the A section, all other groups receiving the grades of B or less. Not more than eight groups in all of the 75 groups tested show any scores reaching into the A grade.
Two other figures are of more especial interest to Dartmouth men: Figure V shows a comparison of the scores gained by the four present classes in college. It will be seen that with the slight variation in the case of the C plus men in the sophomore class, the tendency is a distinct gain in intelligence with each year spent at Dartmouth. It is particularly noticeable that the greatest gain is made from Freshman to Sophomore year. This is in accord with general observation. The least gain is made between the Junior and Senior years, the gain in this case being qualitative, and principally at the lower limit, from C plus to B grade, signifying a tightening up in"the work of the last year.
The last figure, number VI, affords much food for thought. Unfortunately the figure cannot be given the importance attributed to the other figures, due to the fact that at least two of the states have no representative number of men in college. However, for the mere sake of the results obtained the figure is interesting. The question arises: Does it mean that the young men from the different states vary, or do some states send their best sons to Dartmouth while other states keep their best at home? The actual percentages for the ten geographical areas best represented at Dartmouth are as follows:
%A %B %C + 1. Maine . . . . . . . . 85 15 0 2. New Jersey . . . 77 23 0 3. New Hampshire 77 17 6 4. The West . . . . . 73 23 4 5. New York . . . . . 73 19 8 6. Vermont . . . . . . 72 23 5 7. Massachusetts . . 69 27 4 8. Connecticut . . . . 63 31 6 9. Pennsylvania . . . 59 30 11 10. Foreign . . . . . .56 22 22
Fig. I COMPARISON OF DARTMOUTH WITH REGULAR ARMY GROUP.
Fig. II DARTMOUTH COMPARED WITH SIX HIGHESTSCORED OFFICER TRAINING GROUPS.
Fig. III DARTMOUTH COMPARED WITH THE HIGHEST OFFICER GROUPS.
Mech. Engineers. Army Nurses. Bookkeepers. Dental Officers. Mech. Draftsmen. Stenog. & Typists Accountants. Civil Engineers. Y. M. C. A. Secretaries. Medical Officers. Army Chaplains. Dartmouth S. A. T. C. Engineer Officers.
Fig. IV DARTMOUTH COMPARED HIGHEST VOCATIONAL GROUPS
Fig. V COMPARISON BY CLASSES.
Fig. VI COMPARISON BY STATES.
Charles Frederick Echterbecker '18, Instructor in Psychology

Article
-
 Article
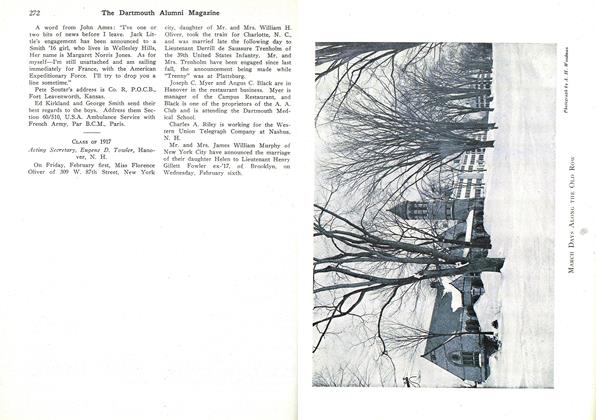
MARCH DAYS ALONG THE OLD ROW
March 1918 -
 Article
October-November 1920
November 1940 -
 Article
Visiting Professor
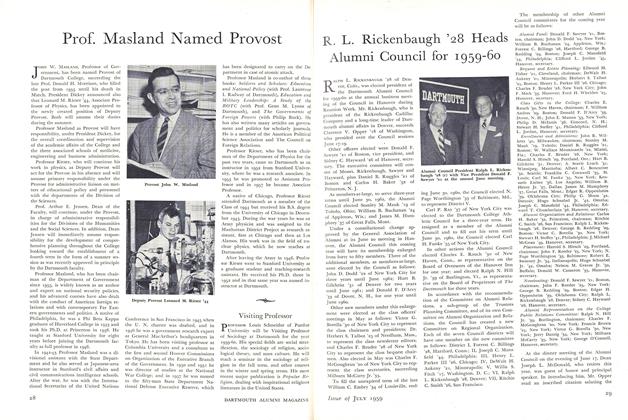
JULY 1959 -
 Article
Valedictory Speaker.
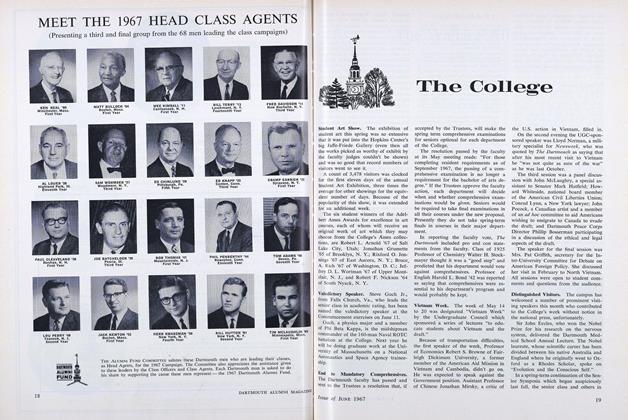
JUNE 1967 -
 Article
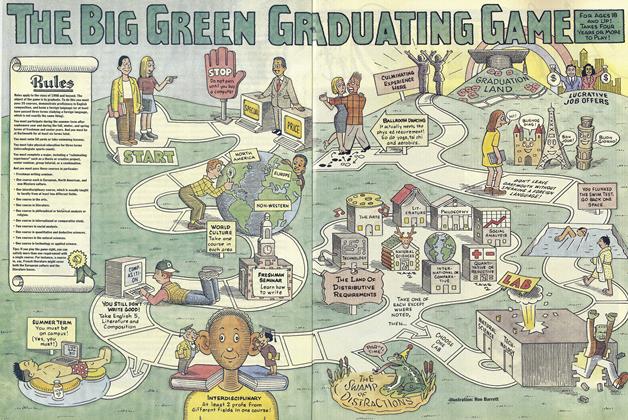
The Big Green Graduating Game
December 1994 -
 Article
THE DIARY OF MRS. PRESIDENT BROWN ON A JOURNEY TO THE SOUTH IN 1819
December 1924


