FRESHMAN MENTAL TESTS
Assistant Professor of Psychology, Dartmouth.
Dartmouth has stood well to the front in educational progress with modified admission requirements, the establishment of the office of Associate Dean, and the use of personal ratings. It is not conceivable that the college will long continue the selection of the personnel of the freshman class on the basis of priority of application. The new big step in Dartmouth progress will be the introduction of a new selective process. Choice by scholarship is unfair, alike to the applicant and to the college, because standards are far from uniform in the various schools. Board examinations are a chance gauge of ability deciding much on a few arbitrary measures of memory. The method of selection must possess none of these defects: it must be uniform and standardized; it must measure power and not merely memory; and it must ensure the selection of the men most capable of profiting by college training. The only means of selection which fulfils all these requirements is the psychological test.
The army Alpha test, since it had been well standardized by the testing of over a million American soldiers, was given to 633 members of the class of 1923 during the fall of 1919. It was not expected that the test would be ideal for college uses, for it was given to the men in the army as a measure of the "general intelligence" required in army situations. But it was thought that such a test would (I) roughly differentiate good from poor men; (II) that it would show to what extent psychological tests may be of value in colleges; and (III) that it would indicate which tests should be retained, which modified, and how. The following data, therefore, serve only as a suggestion of the possibilities of a test formulated and standardized strictly for college use.
I
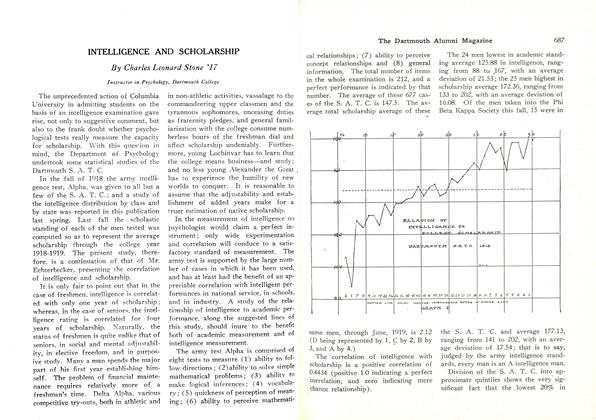
The Alpha test offers a possibility of 212 points. The highest score in the class of 1923 was 203, the lowest 70. The average of all 633 men was 148.4; the average of the 584 men whose records were complete at the end of the first semester was 148.9. The highest quarter of the class in scholarship (2.4 to 3.8) averaged 160.5 ; the lowest quarter (0.0 to 1.3) averaged 137.2. But averages mean very little if there are very extreme exceptions or many minor exceptions. The exceptional cases proved few. Only three of the forty-nine men with 3.0 or above in scholarship were con- spicuously low in intelligence score; and there were nine of the seventy-five men below 1.0 in scholarship who were significantly' high in the intelligence test.
The question logically presented itself, above what point in the intelligence scale we might expect men to be consistently or uniformly good, and below what point consistently or uniformly poor. Of the 102 men above 169, eighty-six passed all their subjects in the first semester, seven failed in one subject, five failed in two subjects and were placed on probation, and two men were separated for scholarship deficiency. In the second semester four more men were separated for like reason. Of the twenty-four men below 110, five passed all their courses in the first semester, three failed in one subject, seven failed in two subjects and were placed on probation, and nine were separated, one for reasons other than scholarship. In the second semester three more were separated, and one transferred to another institution. This fall, at the end of one year's time less than half of the original twenty-four men remained in Dartmouth. All of these men are of such low grade mentally that unless they possess some unusual ability in some specific direction they are not fitted to profit from their college experiences as others are and really are usurping the place of better men who failed to find housing accommodations.
II
The Associate Dean, as a result of his personal conferences with last year's freshmen, reports an astonishing corroboration of the intelligence test ratings. In cases where there has been a considerable disparity between scholarship and intelligence ratings he finds definite explanations.
The administration realizes that every class has its idlers; but it often takes a year or two before it can be adequately ascertained what men get low grades because of idleness and what men get those grades because of mental incapability. Psychological tests would be of great value in effective warnings at the end of the first month in college and would be a more direct means of tracing the student deficiency. Low grades may be caused by excessive extra-curricular activities, idleness, lack of organization of abilities, or mental inaptitude. By use of a percentile chart of scholarship grades — and a percentile chart of intelligence ratings, there would be a check, not only on low grade idlers, but also on average or even superior men who are achieving far below their natural capacity.
Pending the introduction of psychological tests as a means of selecting for admission to college, the college will have a means of knowing, through distribution and tabulation of scores, what chance a man has of making good in college, a fact of no mean significance to the Dean and the Associate Dean, as well as to the college at large.
The various departments of the college may likewise ascertain to what degree intelligence ratings may be taken as a presumption of success in their work; the respective caliber of their A, B, C, D, and E men; and what specific tests best measure success in each field of work.
Analysis of the psychological examination will show particular excellences and deficiencies of the individual student, enabling him to select courses in which he may legitimately be expected to make the most gain. It should serve to furnish the reason for specific failure and indicate thus a readier means of compensation.
The compilation of data on D and E men might be a valuable index of the direction along which special educational emphasis should be laid in this or that class; and an impartial criterion, which the instructor should welcome, of his own strength and weakness.
Indecision as to life work, and ambitions which unrealized deficiencies make impossible of achievement are acute vocational problems of the student which would be solved, in part, at least, by a varied test of mental capacities during the freshman year.
The use of psychological tests should not preclude the use of any other measurements or estimates of ability. Nor should there be any neglect of the many factors other than intelligence which contribute to success, alike in college and after life: besides health and intelligence there are the indispensable qualities of industry, reliability, initiative, and vision; of sociability, sympathy, tact, and sense of humor.
III
The presentation of data on the different individual tests comprising the army Alpha test is out of place in a nontechnical publication. Suffice it to say that statistics worked out on tests given to the class of 1923 and the class of 1924 indicate the needs and direction of modification. A new modified test should have unlimited- possibilities of use.
IV
Tables and Graphs
Table one presents the correlation of the total Alpha test with first semester scholarship in each of the freshman subjects. A correlation expressed by the mathematical value plus 1.0 indicates a perfect relationship between the two qualities measured; a correlation expressed by minus 1.0 indicates a perfect reverse relationship; zero indicates chance. The first column of figures indicates the correlation, the second column the number of students whose records are computed in the correlation.
TABLE ONE Greek .44 11 Latin .29 169 English . 50 594 French .30 405 Spanish . 12 232 German .36 111 Mathematics .38 499 Physics .44 102 Chemistry .31 234 Biology .22 199 Graphics .11 64 History .31 386 Phys Educ. .20 600
The figures in table two indicate what percent of the A men in each subject are in the lowest quarter of the class in intelligence (as determined by Alpha), what percent of the B men, etc.
TABLE TWO A B C D K Greek 0.0% 0.0% 50.0% 66.7% 0.0% Latin 22.2 15.6 18.0 27.3 42.2 English 0.0 6.5 21.4 41.7 68.8 French 11.5 20.9 13.4 32.2 45.3 Spanish 37.5 20.7 15.4 25.6 30.3 German 0.0 16.7 24.4 45.0 26.7 Mathematics 4.4 5.2 26.1 36.9 47.3 Physics 0.0 15.4 16.7 23.8 50.0 Chemistry 0.0 7.1 23.8 36.6 44.1 Biology 10.0 20.0 26.7 31.2 37.8 Graphics 0.0 40.0 24.1 16.7 0.0 History 8.3 12.2 24.2 29.9 47.4 Phys. Educ. 17.7 17.5 20.5 32.5 38.0
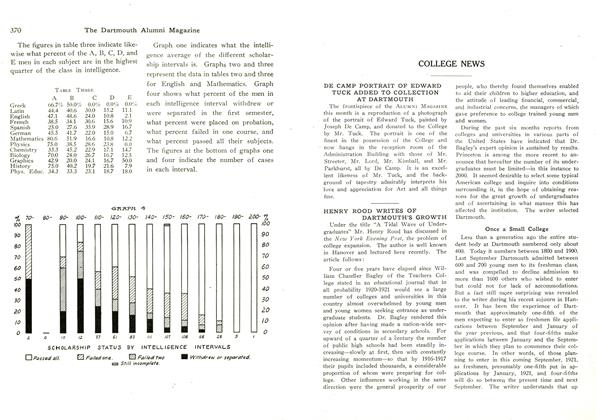
The figures in table three indicate likewise what percent of the A, B, C, D, and E men in each subject are in the highest quarter of the class in intelligence.
TABLE THREEABC D E Greek 66.7% 50.0% 0.0% 0.0% 0.0% Latfn 44.4 40.6 30.0 15.2 11.1 Fnfflish 471 48.6 24.0 10.8 2.1 french 38.5 34.1 30.6 15.6 10.9 Spanish 25.0 27.6 35.9 28.9 16.7 German 45.5 41.7 22.0 15.0 . Mathematics 80.6 51.9 16.6 10.8 12.2 Physics 75.0 38.5 28.6 23.8 0.0 Chemistry 33.3 45.2 22.9 17.1 14.7 Biology 70.0 24.0 26.7 16.7 12.5 Graphics 42.9 20.0 24.1 16.7 50.0 History 75.0 40.2 19.7 21.6 7.9 Phys Educ. 34.3 33.3 23.1 18.7 18.0
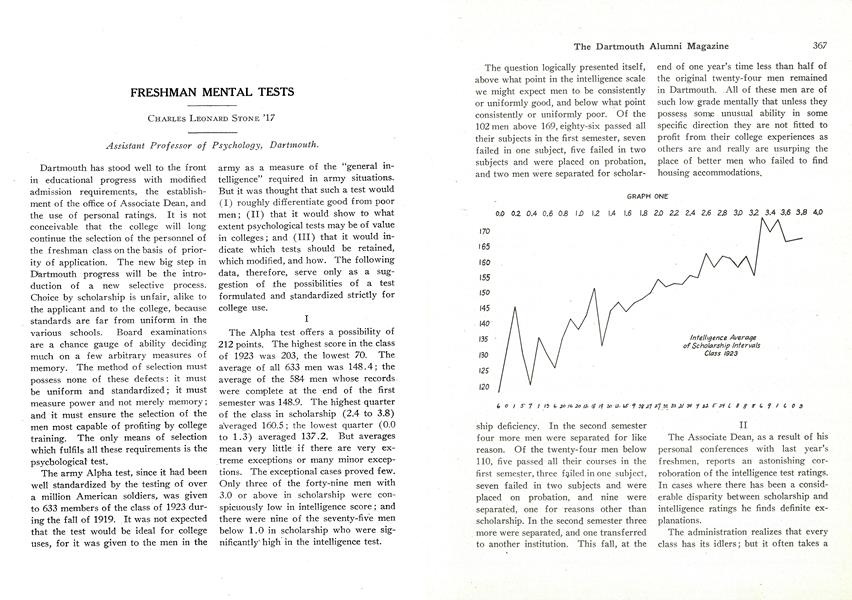
Graph one indicates what the intelligence average of the different scholarship intervals is. Graphs two and three represent the data in tables two and three for English and Mathematics. Graph four shows what percent of the men in each intelligence interval withdrew or were separated in the first semester, what percent were placed on probation, what percent failed in one course, and what percent passed all their subjects. The figures at the bottom of graphs one and four indicate the number of cases in each interval.
More From This Issue
-
 Article
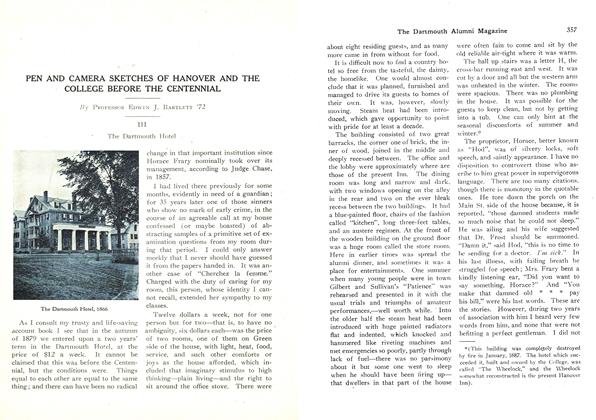
PEN AND CAMERA SKETCHES OF HANOVER AND THE COLLEGE BEFORE THE CENTENNIAL
April 1921 -
 Article
In these days of "drives" the choice seems
April 1921 -
 Sports
BASKETBALL
April 1921 -
 Article
AMERICAN PROFESSORS AND STUDENTS RESENT CHARGES AGAINST FRENCH PEOPLE
April 1921 -
 Class Notes
CLASS OF 1910
April 1921 -
 Article
HENRY ROOD WRITES OF DARTMOUTH'S GROWTH
April 1921