CHARTS AND TABLES
The following charts and tables which were prepared by Gilbert H. Tapley, Assistant Professor of Statistics in the Tuck School indicate in graphical form the tendencies outlined in the preceding article. The figures used as a basis include the enrollment of the College and associated schools.
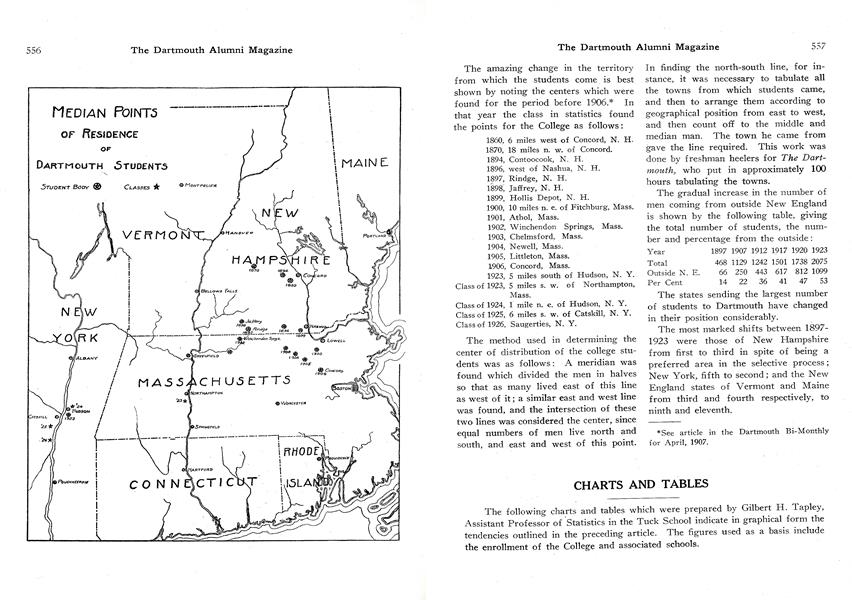
DARTMOUTH COLLEGE, 1890-1922 Chart showing total number of students, the number of students from New England and from outside New England.
CHART A.
This graph emphasizes the rapid growth of the College from 462 students in 1890 to 2075 this year.
It iS interesting- to notice that the growth during the last 15 years has been due almost entirely to the increased number of students coming from outside New England.
All three lines seem to have returned to their pre-war trends. The decreasing rate of growth evident in 1922 was, of course, due to the accepting of only a definite number of the applications for admission.
DARTMOUTH COLLEGE, 1895-1922Chart emphasizing the proportional growth of the total enrollment, of the number of studentsfrom New England and from outside New England.
CHART B.
On this ratio paper, the slope of each line indicates its proportional rate of growth, and a straight line for a period of years shows a constant percentage increase each year. The line of Total Enrollment shows that the College has not been growing at such a rapid rate proportionally to its size during the last IS years as it did from 1895-1907. from 1912 until last year, with the exception of the war years, the College seemed to be increasing at an almost constant rate of about 5 per cent. This year, because of the restricted number of men who could be admitted the increase was only three per cent. It may be of interest to know that the College would have numbered approximately 9400 in another thirty years if the five per cent rate had continued.
Each of the two geographical groups seems also to have had two distinct tendencies one for the first fifteen years and a different one for the last fifteen.
The ratio of growth of the New England group was almost as rapid as that of the whole student body until 1907. Since 1907 there has been almost no increase m New England men.
The ratio of growth of the number of students from outside Mew England was more rapid than that of the College or that of the New England group for the first fifteen years but this increase was very irregular. Since 1907 the number of men outside New Eg shows almost a straight line increase at the rate of approximately 10 per cent a year not considering the two war years, of course. A slackening of this rate was also noticeable this year when it dropped to a seven per cent increase.
DARTMOUTH COLLEGE ENROLLMENT1890-1922
DARTMOUTH COLLEGE, 1890-1922 Percentage distribution of students.
CHART C.
This chart and table emphasize the change which has been taking place in the make-up of the student body.
For the last two years, over half of the men have come from outside New England whereas in 1890 only 51 men, eleven per cent of the students, came from beyond the New England boundaries. By 1898 it was again eleven per cent, but the number had increased to seventy-seven men. Even in 1904, all but 18 per cent came from New England. The chart shows how continuously this change has taken place since 1904.
Table Showing States in Order of Enrollment of Students, 1895- 1922 First Second Third Fourth Fifth Sixth 1895 N.H. Mass. Vt. Maine N.Y. Ill. 1896 N.H. Mass. Vt. Maine N.Y. Ill. 1897 N.H. Mass. Vt. Maine N.Y. Ill. 1898 Mass. N.H. Vt. Maine Ill N.Y. 1899 Mass. N.H. Vt. N.Y. Maine Ill 1900 Mass. N.H. Vt. N.Y. Maine Ill 1901 Mass. N.H. Vt. N.Y. Ill Maine 1902 Mass. N.H. Vt. N.Y. Ill Maine 1903 Mass. N.H. Vt. Ill N.Y. Maine 1904 Mass. N.H. Vt. Ill N.Y. Maine 1905 Mass. N.H. Vt. Ill N.Y. Maine 1906 Mass. N.H. N.Y. Vt. Ill Maine 1907 Mass. N.H. N.Y. Vt. Ill Maine 1908 Mass. N.H. N.Y. Vt. Ill Maine 1909 Mass. N.H. N.Y. Vt. Ill Maine 1910 Mass. N.H. N.Y. Vt. Ill Maine 1911 Mass. N.H. N.Y. Vt. Ill Maine 1912 Mass. N.H. N.Y. Vt. Ill Maine 1913 Mass. N.H. N.Y. Vt. Ill Maine 1914 Mass. N.H. N.Y. Vt. Ill N.J. 1915 Mass. N.H. N.Y. Vt. Ill Ohio 1916 Mass. N.Y. N.H. Ill Vt. Conn. 1917 Mass. N.H. N.Y. Ill Vt. Conn. 1918 Mass. N.Y. N.H. Vt. Conn. Ill 1919 Mass. N.Y. N.H. Conn. N.J. Ill 1920 Mass. N.Y. N.H. N.J. Conn. Ill 1921 Mass. N.Y. N.H. N.J. Ill Conn. 1922 Mass. N.Y. N.H. N.J. Ill Conn.
College Year Beginning In
College Year Beginning In
College Year Beginning In
Looking down West Wheelock Street