SURVIVAL CHART
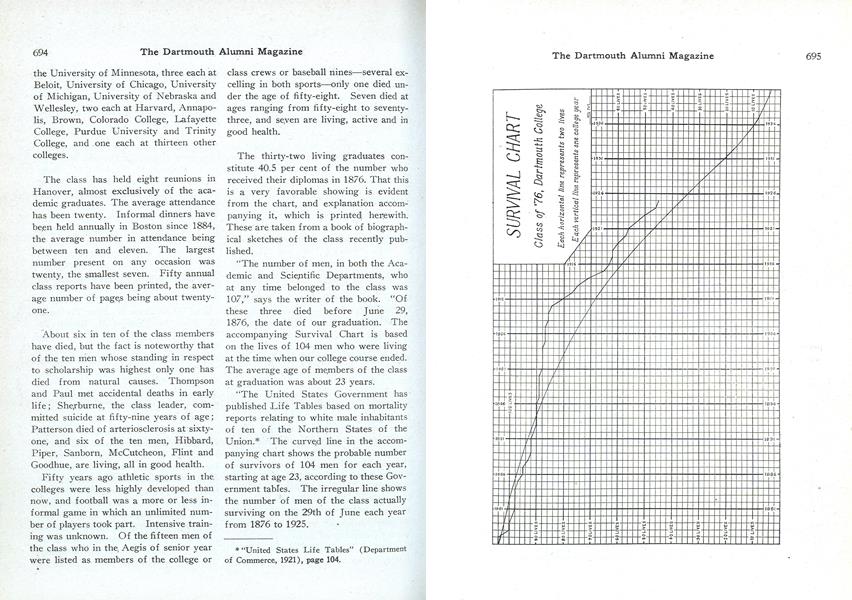
Class of '76, Dartmouth CollegeEach horizontal line represents two livesvertical line represents one college year
"The half-century of the; class may be divided into three practically equal parts. Two accidental deaths in 1877 carried the survival line below the normal curve, and for the first seventeen years after graduation there was a death rate a little greater than normal. In this period fourteen men died. For the seventeen following years, from June, 1893, to June, 1910, the death rate was very low, only five deaths taking place. But in the third period of sixteen years the number of deaths] has been forty-one. A somewhat less rapid death rate, may perhaps be expected in the future.
"Before the end of the second decade the survival line was above the normal curve. The low death rate in the second period of seventeen years placed the class in a very favorable position, and the number of men living in June, 1910, was about fifteen more than might in the ordinary course of events have been expected. But a rapid increase in deaths was inevitable. The number of living men is now about nine more than would have been predicted by the normal curve.
"In June, 1919, according to the Government tables, the number of deaths in the group would have been expected to equal the number of survivors: but at that time the surviving members of the class numbered sixty, or eight more than half the number living in June, 1876. The time when a majority of the class had joined the 'great majority' was thus happily postponed for more than three years.
"In 1931, according to the Life Tables, the number of survivors should be about twenty-one, in 1936 about ten, in 1941 three or four—-but we may hope that the survival line will still continue above the normal curve."
The data on which the chart is based would indicate that 32.8 per cent of any class whose ages at graduation average 23 years may be expected to survive after the lapse of fifty years. The facts available in the General Catalogue show that only 26.6 per cent of the class of 1870 were living in June, 1920, while the surviving membership of the class of 1869 in June, 1919, was 32.8 per cent of the number who graduated, or just the normal percentage,. In the case of the other classes between 1866 and 1875 the number apparently surviving at the end of fifty years is much in excess of 32.8 per cent. Possibly this excess will be reduced as deaths are reported which have been overlooked in compiling the, catalogue. In the case of the class of 1876 it is believed every man is accounted for.
Dr. Henry S. Mackintosh (Harvard 1860) in an article on "Vital Statistics of Harvard College Graduates, 1830-1904," in the Harvard Graduates' Magazine for June, 1907, states that the maximum death rate, among the men is about forty-four years after graduation, but he adds, "another curve . . . seems to indicate that the maximum mortality occurs fortyeight years after graduation." Between thirty-two. years and fifty-six years after graduation, he finds, one-half of all the graduates die.
The Unite,d States Life Tables, however, would indicate that the maximum death rate is about fifty-one years after graduation, and that the shortest period within which one-half the members of a class may be expected to die is the twenty-two years following the thirtyeighth year after graduation.
To what extent figures based on the lives of college men might be expected to differ from those relating to all "white male inhabitants" is a question. The influence of industrial and other nonprofessional employment in this respect is a subject for an insurance actuary.
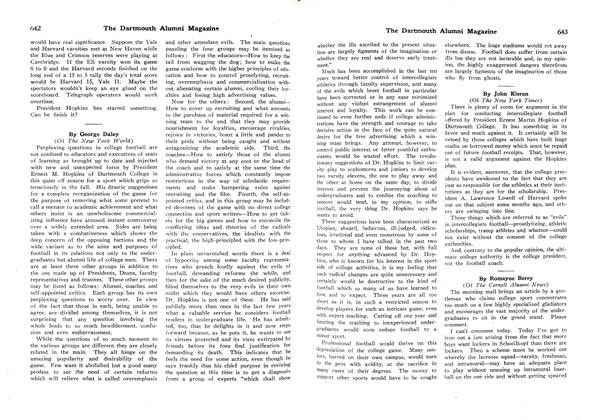
President Hopkins off duty at Southwest Harbor, Maine