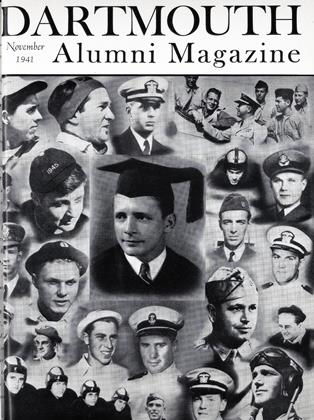
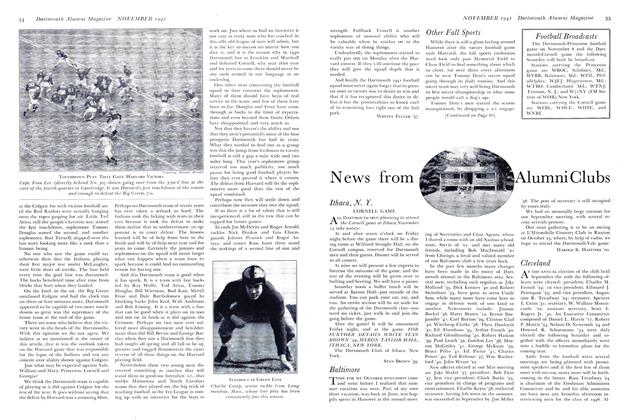
The New Freshman Class
A Description of the Class of 1945 with Comparisons and Trends in Admissions Results Studied and Reported
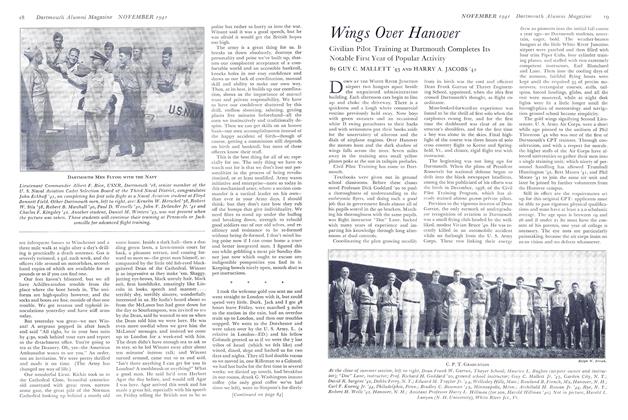
ELEAZAR WHEELOCK, and a later President of the College, Nathan Lord, would probably find the personnel and aims of the new freshman class rather disquieting—for reasons of geographical, economic, and education heterodoxy and notable avoidance of the professions which flourished in their times. President Hopkins and most contemporary alumni must regard 1945 as a perfectly normal freshman class, which follows, with few exceptions, the pattern of classes of the past ten years.
Vital statistics of ail entering class (or any other human group of considerable size) always exhibit a singular lack of vitality. Columns of figures do not answer the question perennially asked by alumni and faculty: "What are the freshmen like this year?" The answer to that one usually has to be postponed until the conclusion of the freshman football schedule, the first set of final exams, graduation, and the Twenty-fifth Reunion. But while not predictive, figures kept from year to year shed some light on the sources and trends of Dartmouth's population; and help to indicate in quantum the composition of each new class. The strength or weakness of a class depends finally on their leaving college rather than on their entrance. The Director of Admissions is Strong, but he is not The Almighty.
This year 723 men were admitted—the largest class in Dartmouth's history. In spite of dire predictions last spring about slackening college enrollment in strained times, these 723 were selected from a gross application list of 2400; which means that the Admissions Office selected one out of 3.3 applicants. In the last ten years this ratio has fluctuated between 2.7 and 3.8. The stability of this proportion is due largely to the 2500 alumni who are actively concerned each year in interviewing, recommending, and selecting the freshman class.
The figure 2500 may cover those alumni who are actively engaged in conducting personal interviews with applicants, with the information thus secured at first hand passed along to Dean Strong and the faculty committee on admissions in Hanover. A much larger number are on the watch for good Dartmouth material. President Hopkins tells about a colleague among college presidents who asked him if it is true that Dartmouth has field agents at work for the purpose of interesting boys in coming to Hanover. "Yes, that's true," said Mr. Hopkins. His friend expressed surprise at this candid confirmation of his worst fears. "How many agents do you have?" he asked. Roughly calculating the size of the alumni body Mr. Hopkins replied: "About 20,000."
INCREASE FROM MIDDLEWEST
In general, the geographical constituency of the new class conforms to the regular distribution we have come to expect in recent years. Here and there a State's delegation is slightly up or down from last year—but the general pattern remains static. Middle-western representation is gradually but steadily increasing year by year, although it is still considerably smaller than the Middle Atlantic or New England groups. Thirty-eight states, two U. S. Territories, and seven foreign countries are represented in the new class, as follows:
(Figures in parentheses are last year's figures.)
New York 145 (155); Massachusetts 126 (116); New Jersey 55 (70); Illinois 51 (34); Connecticut 47 (47); Pennsylvania 40 (28); Ohio 38 (43); New Hampshire 34 (41); Michigan 22 (15); Minnesota 15 (14); Vermont 12 (13). 10 men this year: District of Columbia (8 last year); Maryland (6); Foreign Countries (5). p men: Colorado (14); Missouri (12). 8 men: California (14); Washington (2). 7 men: Indiana (5); lowa (4). 6 men: Maine (5); Rhode Island (10); Texas (o); Wisconsin (6). 5 men: Oklahoma (6); U. S. Territories (2) 4 men: Delaware (7). 3 men: Florida (1); Kansas (2); Virginia (4). 2 men: Montana (1); Nebraska (2); Tennessee (1). 1 man: Georgia (o); Idaho (o); Kentucky (2); New Mexico (o); Oregon (o); Utah (o); West Virginia (2); Nevada (1). None: Alabama (1); Arizona (1); Arkansas (o); Louisiana (1); Mississippi (o); North Carolina (o); North Dakota (2); South Carolina (o); South Dakota (1); Wyoming (o).
As with other recent classes, the most dramatic single commentary on this group is the diversity of its secondary school experience. Its 723 members come from 368 different schools and only 22 of these 368 schools sent groups of 6 or more men! This wide "variety of academic background is tangible implementation of the philosophy back of the Selective Process, i.e.: (1) The quality of work done by a candidate in any school is far more important than the pattern of curriculum which is traditionally held to "prepare for college." (a) Representation is sought from a variety of schools; large delegations and "feeder" schools are discouraged.
Fifty-three per cent of the class entered from 145 private schools—47% are from 223 public high schools. This proportion is exactly that of a year ago. Over the last ten years, private and public school representation has averaged 50%-go%. The schools most strongly represented in this year's class are: Phillips Exeter Academy 25; Vermont Academy 18; Deerfield Academy 17; New Trier Township High School 14; Kimball Union Academy 11; Mercersburg Academy 10; New Rochelle High School 9. The great educational diversity of the class is emphasized in the distribution of schools which sent fewer than g men: 8 men each—3 schools; 7 men each—6 schools; 6 men each—6 schools; 5 meneach—6 schools; 4 men each—l 4 schools; 3 men each—z§ schools; 2 men each—s2
schools; one man 0n1y—249 schools.
An inspection of the size of communities represented by this class shows a picture very like that of recent years. More and more the College is drawing its enrollment from metropolitan, urban, or suburban areas. The country boy is slowly fading out of the picture. However regrettable, this trend is consonant with shifts in population, alumni distribution, concentrations of population and wealth, and consolidation of small towns into cities. A recent study made in connection with school-college relationships indicated that 80% of students in Eastern colleges came from cities or suburbs of cities of over 100,000. Complete figures are not yet available for this freshman class, but it can be presumed that they will follow those assembled by Edward Chamberlain two years ago: Residential Distribution of Students Entering Dartmouth College in: 1899 1919 1939Metropolitan(over 100,000) 44% 64% 71% Urban(10,000-100,000) 22% 19% 16% Rural(less than 10,000) 33% 16% 10% Foreign 1% 1% 3% The mental age of these freshmen will supposedly be discovered by an alert and exacting faculty. Their average chronological age, much more easily determined, was 17.86 on September 15th, with this spread in age groups: Age Number of Men 16 16 17 222 18 353 19 108 20 20 21 2 29 1
This statistical excursion into the obvious reveals only that most boys who come to Dartmouth are 17 or 18 years old when they arrive. Over the last decade, the average age at the time of entrance has been 18.06.
One hundred and nine members (15%) of the class of 1945 are sons of Dartmouth alumni—ten years ago this figure was 10%. Except for 'O4, every class from '97 through '23 has provided at least one freshman this year. Right now the median point for alumni supply of Dartmouth freshmen seems to be the class of 1915. Sons of graduates of 111 other colleges number 291. Best represented are: Pennsylvania (leading as it has for the last three years) 19; Columbia 16; Harvard and Yale 15 each; Michigan 13; Cornell 12. College mothers number 174 from 80 colleges (Smith 24, Vassar 11, Wellesley 7). In 151 cases, parents of freshmen are both college graduates.
Certain admissions statistics each year follow inexorable patterns like the stars in their courses. The law of averages rather than premeditated selection seems to account for this. Tabulation of occupations of fathers of freshmen comes out about the same each year. In rough fashion, the economic spread of the class of 1945 is indicated by what their fathers do: Businessman 396 Lawyer 57 Physician 53 Engineer 36 Educator 23 Artisan 15 Civil Service 14 Accountant 12 Editor 11 Army and Navy 10 Clerk 8 Dentist 7 Chemist 7 Farmer 5 Clergy 4 Artist or Author 3 Miscellaneous 20 Deceased 41
In describing their religious preference on registration forms, freshmen produced some novel spelling variants of one well known denomination "Episcopale," "Episcopalean," "Apiscipalian," "Espociallian." One boy described himself as "Babptiss." Church preferences indicated by freshmen are much the same as in past years: (Figures of a year ago are in parentheses) Episcopal 175 (159) Congregational 122 (115) Presbyterian 120 (130) Roman Catholic 96 (99) Jewish 47 (35) Methodist 58 (36) Baptist 31 (22) Christian Science 21 (19) Lutheran 17 (17) Unitarian 17 (21) Universalist 5 (3) Dutch Reformed 4 (3) Miscellaneous 9 (25) No Preference 20 (10)
Mass data such as the foregoing show something of the origins of the new stream of life which has joined the main current of the College, but they do not reveal what the class is really like. The vocational plans of these freshmen, although subject to change, give definite evidence of their anticipations. Business, most frequently mentioned, shows a downward trend from recent years. The fields of medicine, engineering, science, and aviation attract more students than ever before:
Businessman 199 (217) Physician 120 (111) Lawyer 113 (105) Engineer 83 (55) Educator 49 (45) Scientist 41 (24) Journalist 26 (35) Aviator 10 (8) Dentist 6 (4) Farmer 3 (5) Clergyman 3 (1) Accountant 2 (9) Artist 1 (9) Miscellaneous 36 (36) No preference 20 (10)
Defense courses and the abandonment of Social Science 1 have radically revised the course electives of freshmen this year. 251 freshmen are beginning Spanish this fall; mathematics electives are up 25% from last year; graphics has 142 men and is limited to that number only because drafting instruments are unavailable.
With more freedom in course selection than ever before, freshmen this year have distributed their courses as follows: English 723 (699) Mathematics 376 (301) Spanish 304 (205) French 279 (358) Political Science 264 (not offered last year) Chemistry 256 (226) History 231 (not offered last year) Sociology 185 (not offered last year) Philosophy 184 (224) Geology 136 (162) Economics 96 (not offered last year) Botany 76 (80) Classical Civilization 55 (103) Physics 49 (41) Zoology 38 (66) Music 31 (31) Latin 15 (19) Art 5 (16)
The effect of the defense program and the Tuck-Thayer major is apparent. In these times of defense effort and stress, freshmen are likely to be more than usually perplexed about problems of adjustment, wise course selection, vocational plans, and military service. Accordingly the amount of time devoted to counselling freshmen will be greatly increased this year. As always, the faculty will do some of this. Dean Strong and his assistants in the Freshman Office will know most of the class reasonably by the end of the first semester. Professor Goddard is class officer for 1945.
As in the past, the Personnel Bureau will devote a lot of time to freshmen. This year, two members who are peculiarly trained to assist freshmen have been added to its staff. Professor Bear of the Psychology Department, an expert on remedial reading, will counsel freshmen and continue his work with those men who have reading difficulty. The writer of this article,, who has been on leave of absence doing research on student personnel problems, will, in addition to teaching Freshman English, spend the bulk of his time in freshman counselling.
Fortunately this freshman class is made up of interesting individuals rather than statistics based on where they live and when they were born. Some of these individuals look mighty promising and capable of making unique statistics of their own in the next four years.
The sectional distribution of the class, compared with other classes now in college, is indicated by this table:
1942 1943 1944 1945New England 225 216 232 231 Middle Atlantic 249 248 266 253 Central 138 132 146 171 Southern 26 14 21 21 Pacific 11 16 10 17 Rocky Mt. 11 8 17 15 Foreign 4 11 5 10 U. S. Territories 12 6 2 5 Size of Class 676 651 699 723
WILLIAM S. FREESEPittsfield, New Hampshire
DEAN D. MILLERChicago, Illinois
JOHN C. LOPER Berkeley, California
J. DOSTER ROLFE Seattle, Washington
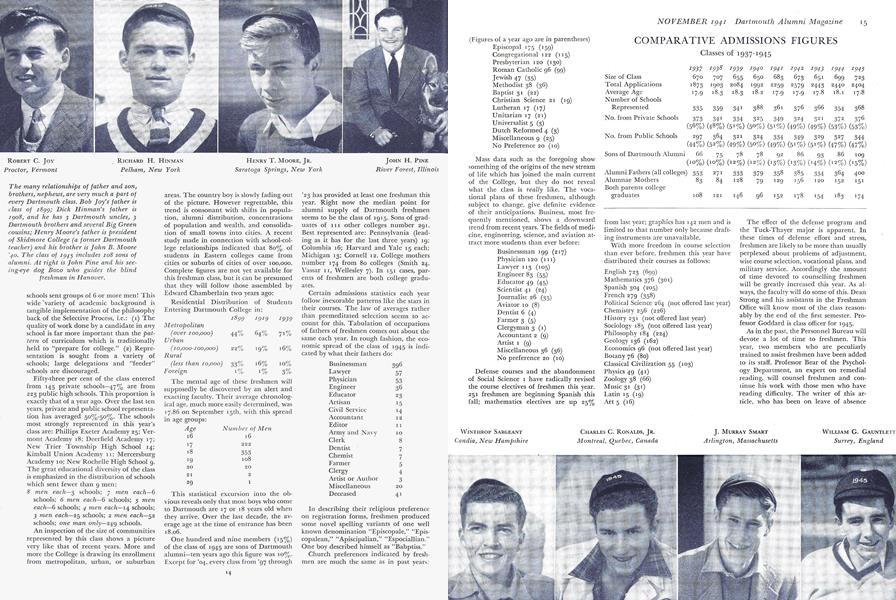
ROBERT C. JOY Proctor, Vermont
RICHARD H. HINMAN Pelham, New York
HENRY T. MOORE, JR. Saratoga Springs, New York
JOHN H. PINE River Forest, Illinois
WLNTHROP SARGEANTCandia, New Hampshire
CHARLES C. RONALDS, JR.Montreal, Quebec, Canada
J. MURRAY SMARTArlington, Massachusetts
WILLIAM G. GAUNTLETT Surrey, England
ASSOCIATE IN PERSONNEL
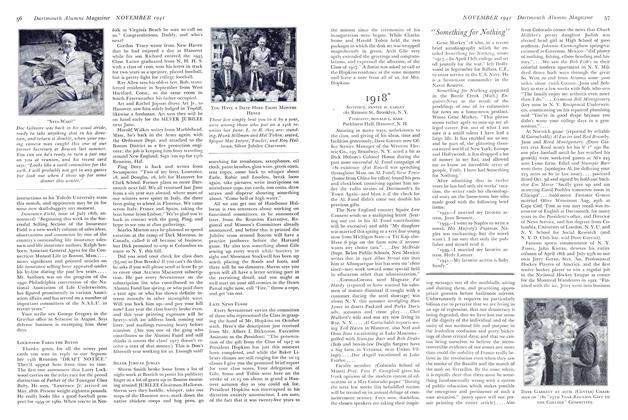
The many relationships of father and son,brothers, nephews, are very much a part ofevery Dartmouth class. Bob Joy's father isclass of 1899; Dick Hinman's father is1908, and he has 5 Dartmouth uncles, 5Dartmouth brothers and several Big Greencousins; Henry Moore's father is presidentof Skidmore College (a former Dartmouthteacher) and his brother is John B. Moore'4O. The class of 1945 includes 108 sons ofalumni. At right is John Pine and his seeing-eye dog Bozo who guides the blindfreshman in Hanover.
COMPARATIVE ADMISSIONS FIGURES Classes of 1937-1945 I937 193$ 1939 1940 1941 1942 1943 !944 I945 Size of Class 670 707 655 650 683 673 651 699 723 Total Applications 1873 1903 2084 1992 2259 2579 2443 2440 2404 Average Age 17.9 18.3 .18.3 18.2 17.9 17.9 17.8 18.1 17.8 Number of Schools Represented 335 359 341 388 361 376 366 354 368 No. from Private Schools 37s 341 334 321s 349 324 321 372 376 (56%) (48%) (51%) (50%) (51%) (49%) (49%) (53%) (53%) No. from Public Schools 297 364 321 324 334 349 329 327 344 (44%) (52%) (49%) (5°%) (49%) (5i%) (5!%) (47%) (47%) Sons of Dartmouth Alumni 66 75 78 78 92 86 93 86 log (10%) (10%) (12%) (12%) (13%) (13%) (14%) (ia%) (15%) Alumni Fathers (all colleges) 353 271 333 379 358 385 334 364 400 Alumnae Mothers 83 84 128 79 129 156 120 152 151 Both parents college graduates 108 121 146 96 152 178 154 183 174