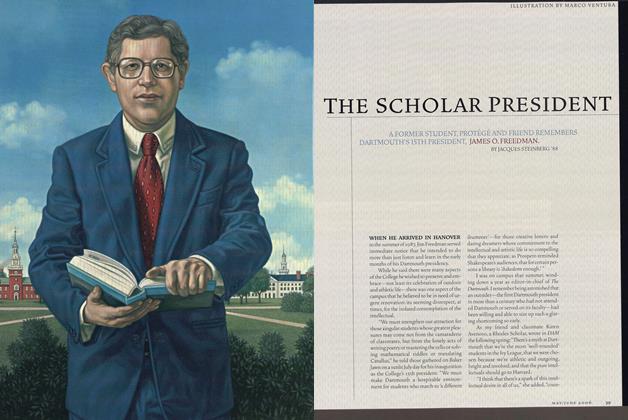
THE ECONOMIC OUTLOOK
An Analysis of the Recent Recession and Prospects for 1955
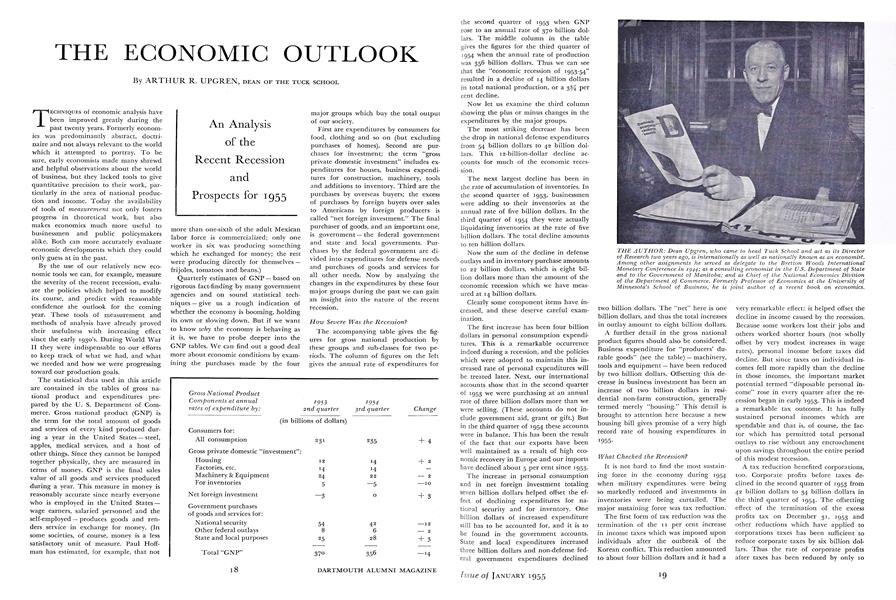
DEAN OF THE TUCK SCHOOL
TECHNIQUES of economic analysis have been improved greatly during the past twenty years. Formerly economics was predominantly abstract, doctrinaire and not always relevant to the world which it attempted to portray. To be sure, early economists made many shrewd and helpful observations about the world of business, but they lacked tools to give quantitative precision to their work, particularly in the area of national production and income. Today the availability of tools of measurement not only fosters progress in theoretical work, but also makes economics much more useful to businessmen and public policymakers alike. Both can more accurately evaluate economic developments which they could only guess at in the past.
By the use of our relatively new economic tools we can, for example, measure the severity of the recent recession, evaluate the policies which helped to modify its course, and predict with reasonable confidence the outlook for the coming year. These tools of measurement and methods of analysis have already proved their usefulness with increasing effect since the early 1930'5. During World War II they were indispensable to our efforts to keep track of what we had, and what we needed and how we were progressing toward our production goals.
The statistical data used in this article are contained in the tables of gross national product and expenditures prepared by the U. S. Department of Commerce. Gross national product (GNP) is the term for the total amount of goods and services of every kind produced during a year in the United States - steel, apples, medical services, and a host of other things. Since they cannot be lumped together physically, they are measured in terms of money. GNP is the final sales value of all goods and services produced during a year. This measure in money is reasonably accurate since nearly everyone who is employed in the United States - wage earners, salaried personnel and the self-employed - produces goods and renders service in exchange for money. (In some societies, of course, money is a less satisfactory unit of measure. Paul Hoffman has estimated, for example, that not more than one-sixth of the adult Mexican labor force is commercialized; only one worker in six was producing something which he exchanged for money; the rest were producing directly for themselves frijoles, tomatoes and beans.)
Quarterly estimates of GNP - based on - rigorous fact-finding by many government agencies and on sound statistical techniques give us a rough indication of whether the economy is booming, holding its own or slowing down. But if we want to know why the economy is behaving as it is, we have to probe deeper into the GNP tables. We can find out a good deal more about economic conditions by examining the purchases made by the four major groups which buy the total output of our society.
First are expenditures by consumers for food, clothing and so on (but excluding purchases of homes). Second are purchases for investment; the term "gross private domestic investment" includes expenditures for houses, business expenditures for construction, machinery, tools and additions to inventory. Third are the purchases by overseas buyers; the excess of purchases by foreign buyers over sales to Americans by foreign producers is called "net foreign investment." The final purchaser of goods, and an important one, is government - the federal government and state and local governments. Purchases by the federal government are divided into expenditures for defense needs and purchases of goods and services for all other needs. Now by analyzing the changes in the expenditures by these four major groups during the past we can gain an insight into the nature of the recent recession.
How Severe Was the Recession?
The accompanying table gives the figures for gloss national production by these groups and sub-classes for two periods. The column of figures on the left gives the annual rate of expenditures for the second quarter of 1953 when GNP rose to an annual rate of 370 billion dollars. The middle column in the table gives the figures for the third quarter of 1954 when the annual rate of production was 356 billion dollars. Thus we can see that the "economic recession of 1953-54" resulted in a decline of 14 billion dollars in total national production, or a 3¾ Per cent decline.
Gross National ProductComponents at annual 1953 1954rates of expenditure by: 2nd quarter 3rd quarter Change (in billions of dollars) Consumers for: All consumption 231 235 + 4 Gross private domestic "investment": Housing 12 14 + 2 Factories, etc. 14 14 Machinery & Equipment 24 22 + 2 For inventories 5 —5 —10 Net foreign investment —3 0 +3 Government purchases of goods and services for: National security 54 42 —12 Other federal outlays 8 6 -2 State and local purposes 25 28 +3 Total "GNP" 370 356 —14
Now let us examine the third column showing the plus or minus changes in the expenditures by the major groups.
The most striking decrease has been the drop in national defense expenditures from 54 billion dollars to 42 billion dollars. This 12-billion-dollar decline accounts for much of the economic recession.
The next largest decline has been in the rate of accumulation of inventories. In the second quarter of 1953, businessmen were adding to their inventories at the annual rate of five billion dollars. In the third quarter of 1954 they were actually liquidating inventories at the rate of five billion dollars. The total decline amounts to ten billion dollars.
Now the sum of the decline in defense outlays and in inventory purchase amounts to 28 billion dollars, which is eight billion dollars more than the amount of the economic recession which we have measured at 14 billion dollars.
Clearly some component items have increased, and these deserve careful examination.
The first increase has been four billion dollars in personal consumption expenditures. This is a remarkable occurrence indeed during a recession, and the policies which were adopted to maintain this increased rate of personal expenditures will be treated later. Next, our international accounts show that in the second quarter of 1953 we were purchasing at an annual rate of three billion dollars more than we were selling. (These accounts do not include government aid, grant or gift.) But in the third quarter of 1954 these accounts were in balance. This has been the result of the fact that our exports have been well maintained as a result of high economic recovery in Europe and our imports have declined about 5 per cent since 1953.
The increase in personal consumption and in net foreign investment totaling seven billion dollars helped offset the effect of declining expenditures for national security and for inventory. One billion dollars of increased expenditure still has to be accounted for, and it is to be found in the government accounts. State and local expenditures increased three billion dollars and non-defense federal government expenditures declined two billion dollars. The "net" here is one billion dollars, and thus the total increases in outlay amount to eight billion dollars.
A further detail in the gross national product figures should also be considered. Business expenditure for "producers' durable goods" (see the table) - machinery, tools and equipment - have been reduced by two billion dollars. Offsetting this decrease in business investment has been an increase of two billion dollars in residential non-farm construction, generally termed merely "housing." This detail is brought to attention here because a new housing bill gives promise of a very high record rate of housing expenditures in 1955.
What Checked the Recession?
It is not hard to find the most sustaining force in the economy during 1954 when military expenditures were being so markedly reduced and investments in inventories were being curtailed. The major sustaining force was tax reduction.
The first form of tax reduction was the termination of the 11 per cent increase in income taxes which was imposed upon individuals after the outbreak of the Korean conflict. This reduction amounted to about four billion dollars and it had a very remarkable effect: it helped offset the decline in income caused by the recession. Because some workers lost their jobs and others worked shorter hours (not wholly offset by very modest increases in wage rates), personal income before taxes did decline. But since taxes on individual incomes fell more rapidly than the decline in those incomes, the important market potential termed "disposable personal income" rose in every quarter after the recession began in early 1953. This is indeed a remarkable tax outcome. It has fully sustained personal incomes which are spendable and that is, of course, the factor which has permitted total personal outlays to rise without any encroachment upon savings throughout the entire period of this modest recession.
A tax reduction benefited corporations, too. Corporate profits before taxes declined in the second quarter of 1953 from 42 billion dollars to 34 billion dollars in the third quarter of 1954. The offsetting effect of the termination of the excess profits tax on December 31, 1953 and other reductions which have applied to corporations taxes has been sufficient to reduce corporate taxes by six billion dollars. Thus the rate of corporate profits after taxes has been reduced by only 10 per cent. If the reports for the railroads were omitted, it is probable that the corporation tax reduction has fully offset the decline in profits before taxes.
Here we see evidence of a second remarkable tax adjustment. Partly planned, partly automatic, the reduction in taxes upon corporate business has almost been sufficient completely to sustain corporate profits in face of the recession. Since business investment in new plant and equipment is influenced most of all by the level of profits, these investment expenditures have indeed been well sustained by the reduction in taxes.
In addition to tax reduction, the government took other steps to combat the recession. Most notable among these was the action of the monetary authorities early in the summers of 1953 and 1954 to increase the availability of credit by purchasing government securities in the open market and by reducing the reserve requirements for member banks of the Federal Reserve System.
We are now able to summarize the factors that contributed to the recession. First was a marked reduction in defense expenditures. This induced some reduction in the rate of business investment in inventories. There was further reduction in the rate of investment in inventories because of the belief that we were in a recession. These were the major forces working toward recession.
Working in the opposite direction, towards the maintenance of output during the recession, were:
1. The tax reduction on personal incomes.
2. The tax reductions upon corporations represented by the termination of the excess profits tax and by those elements in the "tax reform bill" which did reduce taxes on industry generally.
3. The reduction in excise taxes.
4. The passage of a new housing bill liberalizing the terms for the issuance of FHA Insurance upon house mortgages.
5. The very marked easing of credit in June and July of 1953 and in July of 1954.
The advantage of "the new economics" should now be apparent. It enables us to observe the separate streams of economic activity and discern which ones are decreasing and which ones can expand in order that the total stream of gross national production may be adequate to yield, first, the full volume of employment desired in America and, second, the full flow of goods to achieve a higher standard of living. Moreover, it helps us observe how economic policies of the federal government have borne upon the determination of each of the forms of total expenditure which create total economic activity.
This has been a long "autopsy" upon the recession. However, it has the advantage of acquainting us with the tools for estimating the economic outlook as the year 1955 opens. This will be given "officially" shortly after publication of this issue of the ALUMNI MAGAZINE, in the economic report of the President. This report is usually given about mid-January of each year and provides the background for the economic message which the President transmits to Congress.
What Are the Prospects for 1955?
Starting with the introduction of the 1955 models of automobiles in November 1954, the economic outlook has improved. There has been a sharp recovery in the rate of operations of the steel industry. Housing construction is at a high level, approaching the peak reached shortly after the outbreak of the Korean conflict. Inventory liquidation is nearing an end. For perhaps more than a year "we have been selling more goods than we have been making." The excess of sales over production cannot go on indefinitely. By the end of 1955 there may be some positive increase in the inventory account, and it is likely that consumer purchases by the year end will be at the annual rate of 240 billion dollars, an increase of 2 per cent above the level at the end of 1954.
Cuts in defense expenditures during *955 will probably be much smaller than the 12-billion-dollar cut last year. The investment by industry in new plant is continuing at high levels. Recent estimates on the 1955 outlook for these expenditures made by the Department of Commerce and the McGraw-Hill Publishing Company indicate that the expenditure will not decrease in the early part of the year. There is a high degree of liquidity in the economy, credit is easy and it is possible that fiscal policy will be used to increase the "take home" pay of workers. The simplest way would be to increase the personal income tax exemption.
The principal use of the GNP tables, however, is not economic forecasting. The great merit in their use is that they require an orderly presentation of the "measurements of change." These measurements provide a convenient "methodological apparatus" for tracing the consequences of economic policies upon economic output.
THE AUTHOR: Dean Upgren, who came to head Tuck School and act as its Directorof Research two years ago, is internationally as well as nationally known as an economist.Among other assignments he served as delegate to the Bretton Woods InternationalMonetary Conference in 1944; as a consulting economist in the U.S. Department of Stateand to the Government of Manitoba; and as Chief of the National Economics Divisionof the Department of Commerce. Formerly Professor of Economics at the University ofMinnesota's School of Business, he is joint author of a recent book on economics.
More From This Issue
-
 Feature
On Learning
January 1955 -
 Feature
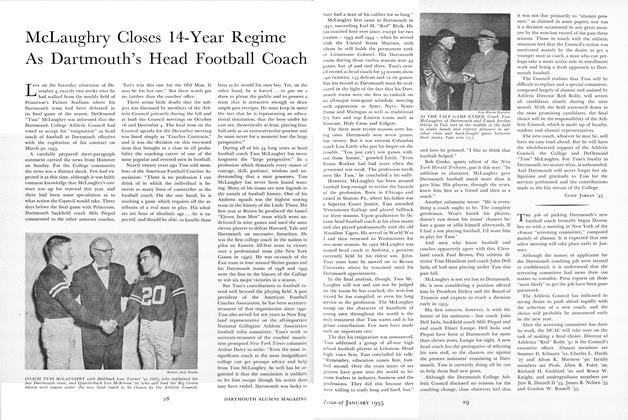
McLaughry Closes 14-Year Regime As Dartmouth's Head Football Coach
January 1955 -
 Feature
Alumni and Tuck Faculty Join In Study of Stock Ownership
January 1955 -
 Class Notes
1918
January 1955 -
 Article
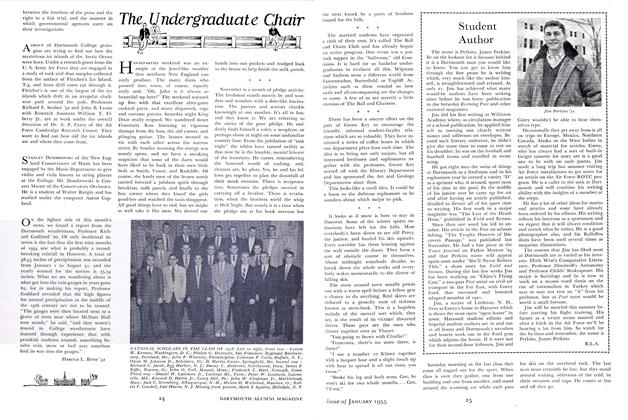
The Undergruduate Chair
January 1955 -
 Article
Twenty Years of "Browsing"
January 1955