VARIATIONS IN THE SCHOLARSHIP OF INDIVIDUALS
RICHARD WELLINGTON HUSBAND, Director of Personnel Research, and HAROLD S. FITZ, Assistant.
The scholarship average of each successive class in college has been worked out for many years. In general this average has seemed to show satisfactory improvement semester by semester. Whenever the average of one semester has been higher than the average of the preceding semester there has been a feeling of satisfaction. Whenever the average of one semester is lower than the average of the preceding semester there has been a feeling that something is wrong in the class.
A numerical average of this kind, however, tells very little of the story. It may very easily happen that the spectacular fall of a comparatively small number of individuals in the class will lower the average to such an extent that we gain the impression that the whole class is doing less well than it did in the preceding semester, while the actual fact may be that the majority of the members of the class have made an improvement. On the other hand, the Spectacular rise of comparatively few individuals may improve the general average of the class while more than half the members of the class have actually lowered their standing.
We need to go beyond the general numerical average of a class to find out the history of the individuals composing the class. It is important to discover whether the rank of the average graduate has a tendency to improve from semester to semester or whether there is some different tendency. If there is, a general tendency on the part of the average individual to fluctuate up and down it is important to know it. If there is a tendency for the average individual in successive classes to show an inclination to a downfall at a certain point in his college career, or a tendency to show marked improvement at a certain point, it is important to discover these points and to look into the causes. It is iniportant also to know when, if ever, the majority of undergraduates begin to show real progress.
For the purpose of this investigation the history of every individual who entered college with the Classes of 1923, 1924 and 1925 has been studied. We have the complete record of the Class of 1923 for eight semesters. We have the record of the C 'lass of 1924 for six semesters and of the Class of 1925 we have the record for four semesters; It would be more satisfactory to have the complete record for eight semesters of perhaps five classes in succession. Unfortunately this would require a period of seven years. During that time conditions might change, and our object is to present a picture as it exists at a certain moment. It would have been possible to give the story of the Class of 1923 and some of those immediately preceding, but it was felt underthat they would present a picture that might now be obsolete. There was the further consideration, in the case of these classes, that the coming of the war broke up the continuity of their work so decidedly that no real or permanent conclusions could be drawn from their history. So our study is only a partial one but it gives real indications of present tendencies.
The first step in this study was to find out the percentage of improvement, or the reverse, made by the individual student from his first to his second semester. We continued this study throughout, his course by comparing the work of each succeeding semester with that of the first semester that he was in college. This method is parallel to the system now commonly in use in estimating variations in prices of commodities. The common practice today is to compare the prices prevailing each year or each month with those of a fixed time immediately prior to the war.
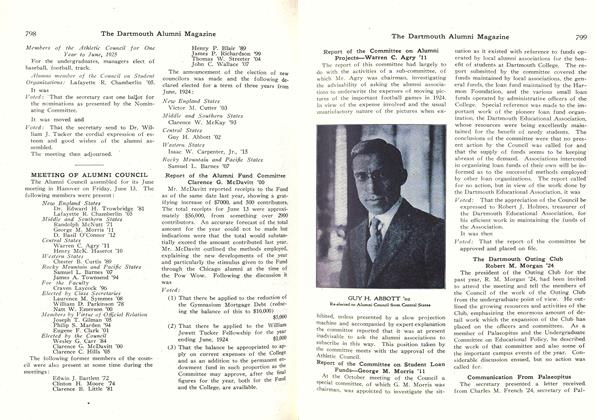
We might find, for example, that a man's second semester was worth 110 per cent of his first semester, that his th:rd semester was worth 105 per cent of his second semester, and that his fourth semester was worth 95 per cent of his first semester. The variations of each individual from semester to semester were entered on work sheets. From these a frequency table was made, showing how many men in a class improved or lowered their rank to given percentage intervals. A table of this kind for the Class of 1923 is reproduced to show the basis for the drawing of the charts which are the essential part of this report.
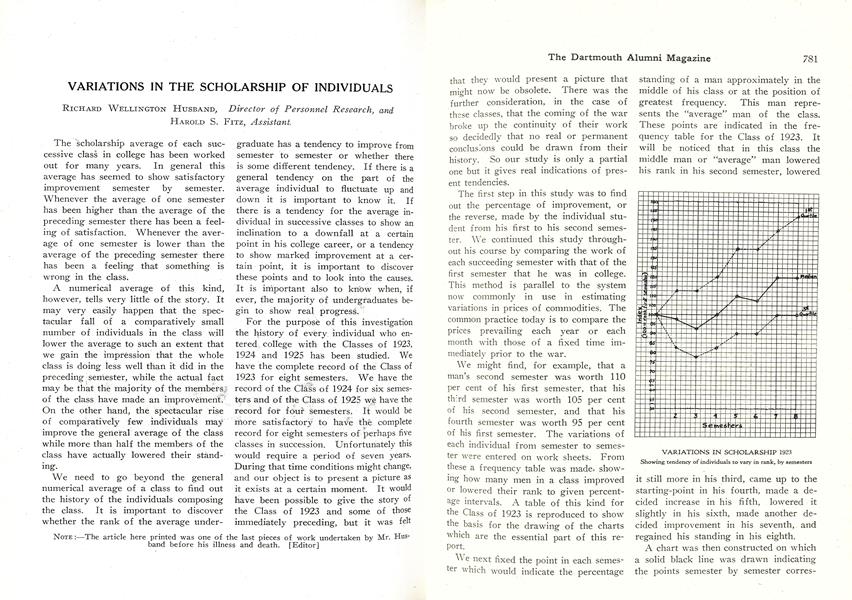
We next fixed the point in each semesLer which would indicate the percentage standing of a man approximately in the middle of his class or at the position of greatest frequency. This man represents the "average" man of the class. These points are indicated in the frequency table for the Class of 1923. It will be noticed that in this class the middle man or "average" man lowered his rank in his second semester, lowered it still more in his third, came up to the starting-point in his fourth, made a decided increase in his fifth, lowered it slightly in his sixth, made another decided improvement in his seventh, and regained his standing in his eighth.
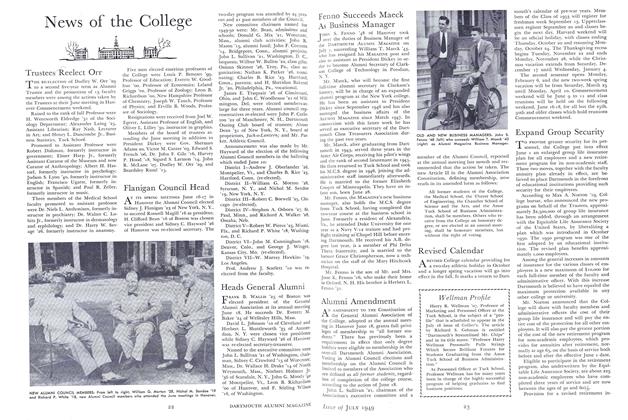
A chart was then constructed on which a solid black line was drawn indicating the points semester by semester corresponding to the markings on the frequency table. This gives a much clearer indication of the history of the middle or median man of the class than the frequency table itself can do. Two other lines were then computed, showing the careers of two other "average" men. The upper one shows the standing of the man who in each semester stood on the
border between the highest quarter and the second quarter of the class. The lower line shows the history of the man who stood on the border between the third and fourth quarters of the class. A glance at the relation of all these lines shows a general drift upward of all three after the middle of sophomore year. In other words, the "average" 1923 did actually have such a career. Between the two dotted lines is included half the class and it is clear that at least 50 per cent of the men in the class did actually improve in their scholarship each semester after the middle of sophomore year. In the Class of 1923 three-quarters of the whole class stood higher in their eighth semester than they did in their first. This is an interesting and important fact.
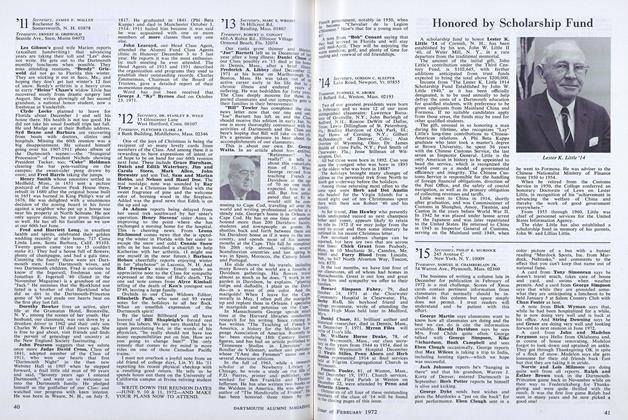
The Class of 1924 had a very different history. It is a curious fact that the middle or "average" man of the class maintained an absolutely level standing through his first four semesters and then began to improve. This seems a more satisfactory condition than the irregularity in the line representing the history of the middle man in the Class of 1923. The highest and the lowest lines in this class are also more regular. We do not know what the explanation of the difference may be but it is a comfort to know that we have a class in college that has maintained itself uniformly since it first entered.
The Class of 1925 had a somewhat strange record for its first four semesters. The middle man maintained his first semester standing at the end of his first year. In the first semester of his sophomore year he had what looks like a rather disastrous downfall. At the end of sophomore year he had partially recovered. It is a very curious fact that the two dotted lines show the same tendency as the solid line in the middle. The whole class seems to have had a bad third semester.
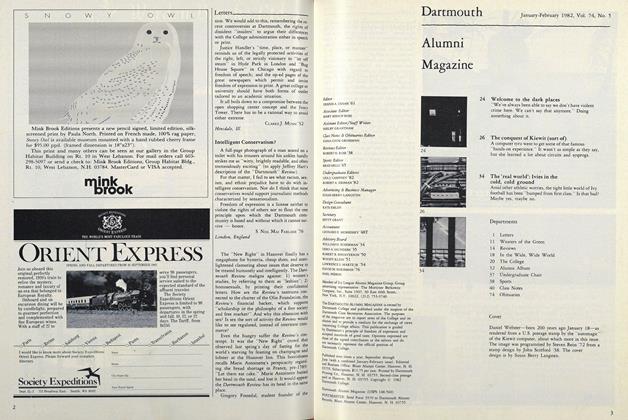
While we were preparing this series of charts, and noticing the striking tendency of the average man to lower his rank in sophomore year, and sometimes in second semester of freshman year, we had the fear that the explanation might be found in the downfall of men who ultimately failed to get their degrees or who left college for some reason, scholastic or otherwise. So we decided to construct a chart for the Class of 1923 in exactly the same way as we constructed the original chart but including the history of those men only who finally got their degrees. This chart is included in the present series for purposes of comparison. The strange thing about it is that there is very little difference in the history, at the end of sophomore "average" man of the whole class. The year, of the "average" man of those who actually got their degrees and that of the one essential difference is that throughout junior and senior years the "average" man of those who got degrees shows a continuous improvement, which is not the case with the "average" man of the whole class.
One further chart is added which shows the trend in scholarship of the middle or "average" man in each of these three succeeding classes. The first startling thing about this particular chart is that it shows so distinctly that the average man has a decided downfall in the first semester of his sophomore year. It is important to discover the cause of this lapse. There is a tradition that sophomore year is the worst of the undergraduate years. It is commonly said that the sophomore does not work regularly, that he does not work enough, and that his attitude toward his studies is not what it was in his freshman year and not what it is likely to be later in his course. It is generally assumed that the sophomore spirit is sufficient to account for the lapse in scholarship during that year.
We do not know enough about the circumstances to account adequately for the fact that we discovered. There can be no question that many sophomores study less than they did while they were freshmen, and yet we had a feeling that there were some other causes at work in addition to the generally recognized unsatisfactory nature of the sophomore spirit. It seemed advisable to turn to a study of the curriculum for a possible explanation. The curriculum at Dartmouth compels freshmen to continue several of the subjects which they studied in their last year in high school. They study, then, in much the same way, they know how to go at these subjects, and know how to get marks in them. With the beginning of sophomore year there is a decided change. Students undertake new subjects. They had heard about those subjects and for the most part they sounded interesting. They expected to have a feeling of joy at dropping the old subjects and tackling some
new ones. When they get started on the new subjects they, are apt to discover that they are not quite what they expected. They are less definite and concrete than were the subjects of freshman year. They are theoretical and the theories relate to topics with which the sophomore has never had any actual contact. His own experience does not help him at all in his understanding of these subjects. The instructors use terms that the sophomore knows nothing about and only half understands when he hears them. This is discouraging and frequently the sophomore gives up in despair or devotes little time to his subjects. It is an unquestionable fact that many sophomores do actually spend more time on their courses than they did when they were freshmen and yet do not make satisfactory progress.
There may be still other reasons to account for the downfall of sophomore year. It is certain there is something involved beyond mere lack of morale. A common statement is that the sophomore spends too much time in student activities. No doubt these do cause many sophomores to neglect their work but so far as our investigation into this subject has gone we are not convinced that there are many sophomores who are injured by their participation in activities. It is not the man who is active in organizations who usually settles down into doing a small amount of work. It is more commonly the man who has little on his hands except his studies.
Many of the books on college life intimate rather clearly that sophomore year is the time when students begin to get restless and to inquire into the values of many things which they had formerly taken for granted. Of course this includes questions of the value of scholarship in general and the value of various subjects in particular. So long as a student is not sure of the value of what he is studying he has less heart in careful and enthusiastic preparation than he would have if he were really certain in his mind. We are inclined to think that of all these points the curriculum is the most important factor.
As students pass beyond their sophomore year it is commonly said that they become serious and more interested in intellectual things. It is said that they work harder and that is why they get better marks. We discovered that the average man had exactly the tendency that was indicated in the common belief. He does make an improvement in his junior year, and another improvement in his senior year. At the beginning of our study we felt that if there was a tendency on the part of upper classmen to get better marks than they got when they were under-classmen the common explanation might be accepted as the correct one. Nevertheless we were somewhat bothered by an investigation that was made last year and published in TheDartmouth to the effect that seniors actually spend about one hour less per day on their studies than freshmen do. If seniors devote a smaller amount of time to their work where is the proof of greater interest? If, notwithstanding the smaller amount of time they give to their studies, they get higher marks, the explanation must be that they know better how to get marks. We wondered if this was an indictment of our system of major studies.
We might go on almost indefinitely with this discussion of the problems which our investigation has undoubtedly raised, but we hesitate to do so. We merely make our conclusion that with these new presentations of scholarship conditions as they actually exist, considerations of the various scholarship problems now confronting the college should be clarified somewhat and solutions be made more feasible.
VARIATIONS IN SCHOLARSHIP 1923 Showing tendency of individuals to vary in rank, by semesters
VARIATIONS IN SCHOLARSHIP 1924 Showing tendency of individuals to vary in rank, by semesters
VARIATIONS IN SCHOLARSHIP 1925 Showing tendency of individuals to vary in rank, by semesters
Showing variations in Scholarship of individuals who graduated with the class of 1923
NOTE :—The article here printed was one of the last pieces of work undertaken by Mr. Hus- band before his illness and death. [Editor]