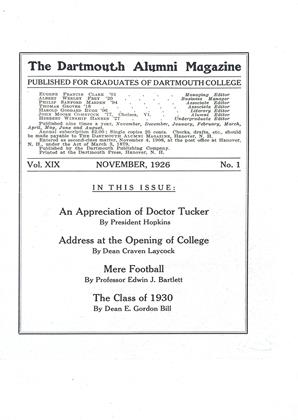
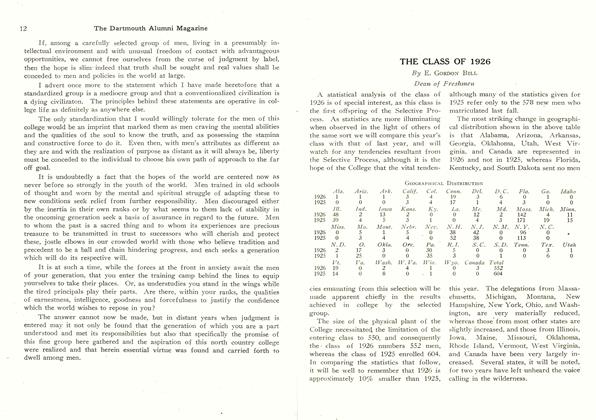
THE CLASS OF 1930
Alumni will be interested in reasons why the College numbers over 2100 men this year, whereas by a trustee regulation it is limited to 2000. The entering class is selected in April, and owing to the facts that our tuition had increased and we were for the first time admitting no men with conditions, the Director of Admissions was instructed to admit a class of 650 men. Then the unexpected happened, for instead of the class of 1929 losing 30 odd members by scholastic failures last June, it lost only 6. In other words, it set the unprecedented example of losing only 30 men for scholastic failure throughout the entire year. Normal shrinkages failed to develop, and the result h a college of the present size. Of course the remedy next year is obvious, a very much smaller freshman class, which means even more wailings and gnashing of teeth than developed this year, when the quality of the material was very good.
The Bursar tells me that it will cost too much money to get a stencil for all of these articles, so my only hope in writing this statistical comparison of the classes of 1930 and 1929 is that readers of this magazine have sent their last year's' copies to the attic.
The entering class this year numbers 661 as compared with 638 last year, and consequently all figures are readily comparable. It is interesting to the writer to call attention to the fact that of the 661 men in this class, 5 are drop-backs from 1929, and 6 are transfers from other colleges, leaving exactly 650 men admitted by the Selective Process. This sets a standard of accuracy which will be our despair in the future.
GEOGRAPHICAL DISTRIBUTION
1930 1929 1930 1929 1930 1929 1930 1929 1930 1929
Ala. 0 0 111. 46 39 Miss. 0 0 o. 43 42 Va. 0 0
Ariz. 0 Ind. 5 7 Mo. 4 6 Okla. 8 3 Wash. 2 0
Ark. 0 0 lowa 4 4 Mont. 3 0 Ore. 0 4 W.Va. 6 2
Calif. 43 Kans. 3 1 Nebr. 5 8 Pa. 3238 Wis. 6 6
Col. 8 7 Ky. 0 1 Nev 0 0 R.I. 8 10 Wyo. 0 0
Conn. 38 40 La. 1 0 N.H. 39 45 S.C. 0 0 Foreign 12 4
Del. 3 2 Me. 6 11 N.J. 47 48 S.D. 1 0 Total 661 638
D.C. 6 8 Md. 33 N.M. 0 0 Tenn. 43
Fla. 4 7 Mass. 156 145 N.Y. 110 103 Tex. 22
Ga. 0 0 Mich. 14 11 N.C. 0 0 Utah 0 0
Idaho 1 1 Minn.147 N.D 0 0 Vt. 1316
The most striking figure in the above table is the number of freshmen from Oklahoma. Even if there is not so much oil in other states, alumni from the southwest should certainly look to their ldurels. Minnesota, with 14 men, and West Virginia with 6, are worthy of note. It is to be regretted that NewHampshire, Maine and Vermont show a slight falling off in percentages, and it is a continual regret to the Director of Admissions that Alabama, Arkansas, Georgia, Mississippi, Nevada, New Mexico, North Carolina, North Dakota, South Carolina and Wyoming continue year after year without representation. This is a problem which the alumni might well attack.
SECTIONAL DISTRIBUTION
1929 1930New England 267 260Middle Atlantic 194 195Southern 26 31Central 131 145Rocky Mountain 9 12Pacific 7 6Foreign 4 12Total 638 661
The New England percentage now stands at 39.4, as compared with 41.8 last year. This ratio has decreased with a remarkable regularity—although for the class of 1927 it was only 38.8—which means that the center of the College continues to move westward. This is due to the fact that the representation from the Central States to a large extent, and from the Pacific States to a small extent, continues to increase. Perhaps the most remarkable change in the geographical distribution of men entering the College is the fact that this class numbers 12 students from foreign countries; Canada, China, France, Japan, Jugo-Slavia, Switzerland and Syria being represented, as well as such outlying districts as Hawaii and Porto Rico. Being of English birth, I had some difficulty in deciding how these places should be classed, whether as dependencies or dominions or possessions.
FAVORED GROUPS
1929 1930Alumni 30 36New Hampshire 48 39West of Mississippi -47 59South of Ohio and Potomac 21 21Foreign 4 12
We are personally very unhappy at the decrease of the New Hampshire delegation, the percentage from this state being much the smallest in the history of the College. Personally I believe this is due largely to the mistaken feeling among boys from the rural sections of the state that our increase in tuition and the general high expense for a year at Dartmouth preclude their coming here. Each alumnus in the state should make it a point to disseminate the fact that although we are tremendously lacking in scholarship funds as compared with many other colleges, and in fact have to use money from our capital account each year to take care of needy students, nevertheless the increase in tuition is not to be allowed to keep any first-class boy, no matter how financially needy, from being educated at Dartmouth College.
It may be of interest to point out that although the number of men entering the freshman class from south of the Mason and Dixon line has not changed much during the past few years, increasing numbers of southern boys are entering each year as transfers to the upper classes.
OCCUPATIONS OF PARENTS 1930
Business Executive 104 Merchant 79 Manufacturer 57 Physician 39 Lawyer 36 Banker 31 Artisan 27 Engineer 27 Realtor 26 Education 21 Salesman 19 Insurance 17 Farmer 12 Civil Service 12 Druggist 9 Broker 8 Clerk 9 Municipal Officer 7 Hotel 7 Editor 6 Printer 5 Advertising 5 Accountant 5 Dentist 5 Judge 4 Chemist 3 Ship Captain 3 Retired 14 Deceased 44 Miscellaneous 20
I have not given this table for the class of 1929 because this year I personally analyzed the occupations of parents, and then found that my classification did not agree with any that had been used before. However, I had a lot of fun out of it, and expect to be able to give a comparison next year. Incidentally, I would strongly advise, instead of cross word puzzles, an analysis of the occupations of any 650 men.
The most staggering fact to me in the above table is that 104 fathers are business executives. I have been pained to note that no clergyman and no undertaker have risked a boy with the class. There is no artist's son in the class, which reminds me that the two boys who upon entering this fall indicated that they hoped to become artists have already withdrawn, one because he "hated it here," and the other because he disliked the accommodations. This will be interesting news for those alumni who fear that Dartmouth has developed an atmosphere too favorable to artists. Two boys in the class are sons of locomotive engineers, it being fairly clear that their fathers do not run over any road leading to Lewiston. The father of one freshman is a "podiatrist," which seems to indicate that more and more people are becoming interested in the bee industry.
Perhaps it will be interesting to compare for the two classes a few of the better known occupations:
1929 1930 Banker 15 31 Clergyman 3 0 Educator 21 21 Engineer 31 27 Farmer 14 12 Insurance 17 17 Lawyer 36 36 Manufacturer 58 57 Merchant 83 79 Physician 49 39 Realtor 23 26
Perhaps the most notable change in the Church Preferences table is the increase in the number of Jewish students, a change from an average of about 3% in other years to 5.6% for the class of 1930. I have always been interested in the number of "no preference" freshmen, familiarly known in this office as heathen. It has often been rumored that many of these were simply being untrue to the faith of their fathers. Consequently this year I started to analyze their names, but as the first three were respectively Raphael, Harry, and Michael, I desisted. Those readers who have had any doubts concerning the way things are run at Washington will be glad to know that one freshman prefers the Congressional church.
CHURCH PREFERENCES
1929 1930 Baptist 35 38 Christian 5 3 Christian Science 22 24 Congregational 139 135 Dutch Reformed 0 4 Episcopal 107 107 Ethical Culture 1 1 Jewish 13 37 Lutheran 10 12 Methodist 72 70 Presbyterian 94 95 Roman Catholic 63 70 Unitarian 18 20 United Brethren 0 2 Universalist 5 10 Miscellaneous 6 5 No preference 48 28 Total 638 661
One hundred and seventy-six (176) sons of college men compares with 168 in the last class. Sixty-one (61) sons of college mothers is quite a drop from 68 in the class of 1929. The average year of graduation of the 36 alumni is about 1897, and the list this year contains one adoptive father who is also the grandfather, and who graduated in 1870. The fathers of two boys were in the class of 1906.
The colleges ranking next to Dartmouth in sons in the class are: M. I. T. 8, Cornell 6, Michigan 6, B. U., Columbia, Harvard, Pennsylvania and Wisconsin 5 each. Last year they were M. I. T. 11, Yale 9, Columbia 8, B. U. and Harvard 5. This year Smith has 7 boys in the
COLLEGE TRAINING OF PARENTS
1929 1930 Sons of Dartmouth Alumni 30 36 College Fathers 168 176 No. of Colleges 82 79 College Mothers 68 61 No. of Colleges 38 38 Both Parents College Bred 36 35 class, Hunter 5, Mt. Holyoke and Wellesley 4. Last year Hunter had 6, Mt. Holyoke, Smith and Wellesley 5.
SCHOOL REPRESENTATION
No. No. No. of from from Schools Public Private Public Private 1930 347 238 109 387 274 1929 334 232 102 395 243 Of course the most interesting fact illustrated in the above table is that 347 schools are represented in the class of 1930. I wish to repeat and reemphasize that this represents the most important phase of our system of admission. It will be noted that the number of boys from private schools is increasing fairly fast. This will continue, in all probability, on account of two factors. First, Dartmouth is known to be a very difficult college in which to succeed scholastically, and more and more students are taking an extra year in preparation. Second, the present policy of admitting no men with conditions will of course result in more men taking a finishing-off year after graduating from high school, in order to get some necessary extra credits.
The number of single boy schools continues to grow satisfactorily. This year 223 schools were represented by just one student in the class. This year the largest delegation has dropped off. The class of 1928 had 28 boys from one school, the class of 1929 had 22, and this year 12 men from Exeter represent the largest delegation from any one school. On the contrary, groups of seven and more men from single schools have very noticeably increased over previous years, there being 14 such groups as compared with 8 last year. The ranking delegations in size this year are as follows: Phillips Exeter 12, Clark School 11, Culver Military Academy 10, Mercersburg Academy 10, Tabor Academy 9, Shattuck School 9, Worcester Academy 9.
NUMBER OF STUDENTS FROM A SCHOOL
1 2 3 4 5 6 7 8 9 10 11 12 14 22 1930 223 59 31 14 6 4 4 3 3 2 1 1 0 0 1929 210 80 22 13 6 5 1 2 2 1 0 0 1 1
METHODS OF ADMISSION
1929 1930 Certificate 549 528 Examination 32 51 Examination and Certificate 55 76 "Special Certificate" 206 303 With conditions 113 0
Of course the outstanding thing to be observed in the above table is that no man entered the class of 1930 with entrance conditions, whereas last year 113, which incidentally was a record minimum number, had some sort of conditions. The Committee on Admission this year admitted without condition 19 men whose formal credits totaled I4 1/2 or 14 units, but whose qualifications for admission seemed unquestioned.
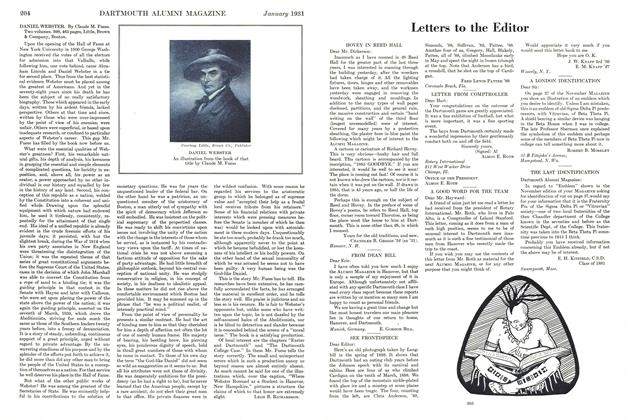
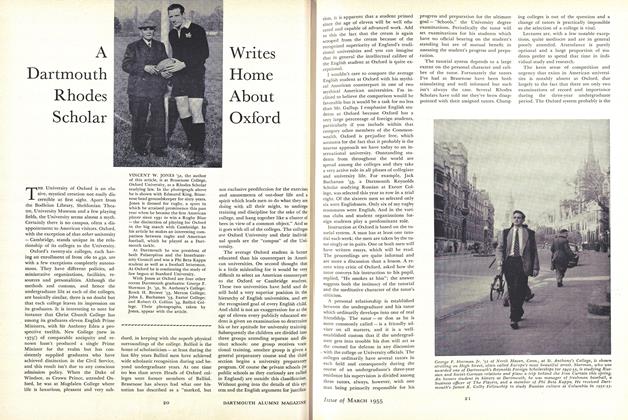
The New Fireplace on the Summit of Mooselauke