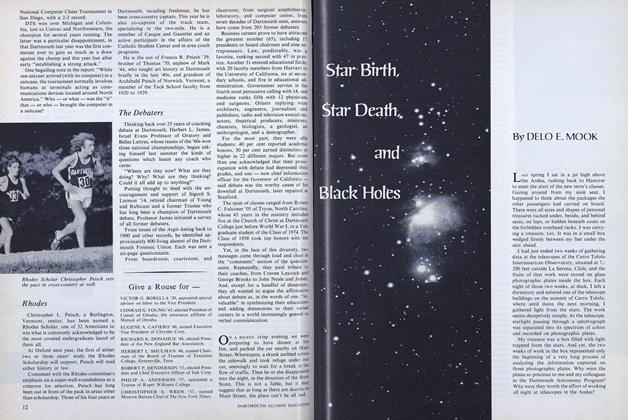
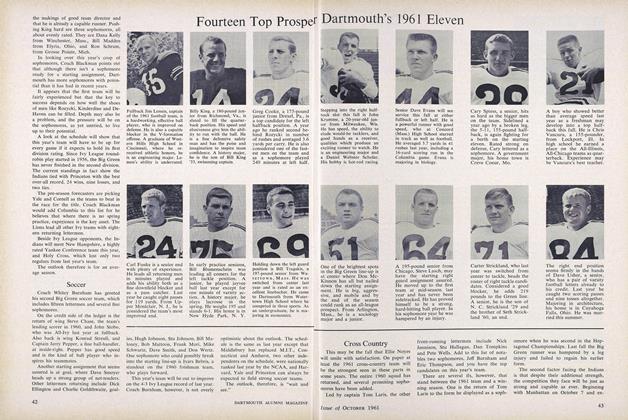
The Class of 1932
THE CLASS of 1932 has already established one record which should stand for sometime. Four of its members withdrew from college within the first week, two because they were orphans who, not at all strangely, found that they could not finance themselves as easily in Hanover as in New York, one because he had been homesick for several years, and one Oriental because he had formed the habit a year ago, as a member of the Class of 1931, of withdrawing during the first week of college.
As everyone knows, it has been for many years the intention of the trustees to limit the undergraduate college to two thousand men, but either because during recent years the Director of Admissions has chosen too well or too many, the college has been running some- what over twenty-one hundred, so that the Admissions Office this year admitted forty less freshmen than last year, 586 compared with 626, and a considerably smaller number of transfers. Consequently we all expected the total college to be almost exactly twenty-one hundred, but the Registrar of the college can prove to anyone who is interested that the actual size of the undergraduate college this year is only slightly smaller than last year. The Director of Admissions has finally come to the conclusion that the only medicine which will be efficacious in reducing the college is to feed it smaller and poorer classes.
The Class of 1932 is a young class, the average age being 18.13 years as compared with the average for the last seven years of 18.28 years. The oldest member of the class is 26 years old and there are three boys in the class who have not yet seen 16. Incidentally all four look good.
In connection with these three young students, it may be of interest to alumni to know that one trick the Director of Admissions uses in trying to admit a small class without refusing top-notch boys is to persuade parents of boys fifteen, sixteen or even seventeen years of age to give them an additional year of preparation and maturing. It may be fairly argued that whereas in a large city university extreme youth and immaturity may not be a great handicap in getting the most the institution has to offer, the writer believes that in a college of the type of Dartmouth with its compact and intimate community life all matriculants should have reached a certain maturity which may come at fifteen but usually not before eighteen. In any case, the Office of Admissions at the present time is asking young applicants to prove to it that they would not be greatly benefitted by waiting a year.
GEOGRAPHIC DISTRIBUTION
AlabamaArizonaArkansas
1932 1931 0 1 0 1 0 1
New HampshireNew JerseyNew Mexico
1932 193132 4636 44 0 0
CaliforniaColoradoConnecticut DelawareFloridaGeorgiaIdahoIllinoisIndianalowaKansasKentuckyLouisianaMaineMarylandMassachusettsMichiganMinnesotaMississippiMissouriMontanaNebraskaNevada
8 107 424 332 2 2 2 2 0 1 0 41 526 86 4 0 1 5 4 0 0 6 74 2127 14915 1011 6 0 0 33 2 2 4 3 0 1
New YorkNorth CarolinaNorth DakotaOhioOklahomaOregonPennsylvaniaRhode IslandSouth CarolinaSouth DakotaTennesseeTexasUtahVermontVirginiaWashingtonWest VirginiaWisconsinWyomingDist. of ColumbiaForeignTotal
184 107 0 0 1 332 342 3 0 0 29 302 7 0 0 0 2 3 233 1 1 7 11 2 0 2 30 3 8 8 3 0 7 46 9586 626
Of course incomparably the most interesting item in the above table is the fact that the representation from New York is larger than that from Massachusetts. This happened once before in 1923, but the Massachu- setts delegation for the past seven years has averaged no less than forty-two more than that from New York. If this large New York delegation is as good scholastically and in other ways as the large Massachusetts groups have always been we will be satisfied. It is of course easy to note variations in the geographical distributions of 1931 and 1932, but a study covering many classes instead of two indicates that these variations in all probability mean nothing. We can say, however, for the class of 1932 that its representations from Georgia, Kentucky, Michigan, Virginia and Wyoming are considerably larger than usual, whereas its representations from Kansas and'1 West Virginia are decidedly smaller than usual. Only the states of Mississippi and New Mexico have failed within historic times to send students to our entering class. Who will be the alumnus to furnish the voice to cry in the wilderness of these two states? The foreign group represents Canada, China, Mexico, Porto Rico, Trinidad and Syria.
SECTIONAL GEOGRAPHIC DISTRIBUTION
StatesNew EnglandMiddle AtlanticSouthernCentral
1932 1931198 253205 18526 23127 134
StatesRocky MountainPacificForeignTotal
1938 1931 14 9 10 13 586 626
The New England delegation has dropped from 40.4% for the class of 1931 to 33.8% for 1932, the latter being unquestionably the smallest New England repre- sentation we have ever had. This shrinkage in New England has been made up by a decidedly larger group from the Middle Atlantic states and slightly larger groups from the Southern and Rocky Mountain states. In passing, it may be of interest to someone to hear that the writer has met personally each of the Southern members of the class and that he feels that they are a superlative group, many of whom will be heard from as the college years go by.
FAVORED GROUPS
Alumni New Hampshire West of Mississippi
1932 1931 36 45 32 46 54 51
South of Ohio and Potomac Foreign
1932 193121 16 6 9
For the past seven years the delegation from New Hampshire has averaged forty-seven men. This shows how small the New Hampshire group is in the Class of 1932. Certainly it is the smallest. New Hampshire group proportionately that ever entered Dartmouth College. Perhaps the expression "Favored Groups" should be explained briefly to the alumni. The Selective Process states approximately that selection shall be made of all properly qualified sons of Dartmouth alumni and Dartmouth College officers, residents of the state of New Hampshire, districts west of the Missisippi, and districts south of the Potomac and Ohio Rivers. It is the writer's belief that people reading the Selective Process, in general miss in the above the words "properly qualified." In fact the entire provision relative to the favored groups simply means that other things being reasonably equal, members of these groups will be admitted provided that in addition to having the required units their records indicate a reason- able assurance that they can and will do the work at Dartmouth. Each year, however, many applicants from each of the four favored groups are refused admission, either to give them a chance to take further preparation or to enter some other institution for which they are better fitted. So, ye alumni fathers, tell your infants that their birthright per se, yes, even if reinforced with fifteen units, will not insure their admission to the alma mater if every other thing seems to indicate that Dartmouth College is not the place for them to get their best development.
OCCUPATIONS OF FATHERS
Business Executive Merchant Manufacturer Physician Lawyer Banker Artisan Engineer Realtor Education Salesman Insurance Farmer Civil Service Druggist
1932 1931 133 136 56 56 47 47 35 24 36 39 23 11 17 34 23 28 19 25 21 20 22 17 22 15 14 13 6 11 6 2
Broker Clerk Municipal Officer Clergyman Architect Editor Printer Advertising Accountant Dentist Artist Contractor Chemist Miscellaneous Total
1932 1931 15 16 7 7 2 1 7 9 3 0 9 3 3 6 4 4 12 6 9 6 2 0 16 20 2 3 15 67 586 626
The Occupations of Fathers table should be published each year without comment as the apparent variations from year to year depend as much on the clerk making the study as on the nature of the father's job. For the sake of continuity I always plan to do this table personally but never quite make the grade when the time arrives. Incidentally, freshmen in general on registration day are not very sure of what their fathers do for a living and many a "business executive" is probably what I used to call a clerk. Comparisons are particularly misleading this year as we cut out the retired and deceased of other years and tabulated what the occupations were at the time of retirement or decease.
As I have nothing to say this year about the bee industry, I will simply point out that in spite of all recent motor mergers one father is a horse dealer. Two members of the class are sons of fishermen, one of a producer of motion pictures, and one of a chef. In passing, I would like to inquire whether anyone has ever heard of any graduate of the Dartmouth Medical School who has not at least tried to send his boy to Dartmouth College.
PROPOSED VOCATIONS
Business Law Medicine Engineering Education Journalism Chemistry Advertising Architecture
1932 1931 105 125 78 77 45 58 29 22 10 19 10 13 6 7 3 6 3 4
Science Diplomatic Service Music Dentist Theology Miscellaneous None Total
1932 1931 2 4 1 3 3 0 3 0 0 1 7 9 281 278 586 626
Apparently the more leisure available for the average citizen the more need there is for doctors and educators. It is also of interest to observe that although practically no one enters college with the idea of going into the ministry, a considerable number of each graduating class choose that profession, which seems to indicate that there is something wrong with the oft repeated argument that college is a place in which boys lose the faith of their fathers and find nothing to replace it. Each class now contains men planning to be aviators, motion picture producers, and, thanks to these infirm old bodies of ours, athletic coaches and morticians. Best of all, however, 281 members of the class have no idea what they will probably do for a living. Conferences to date with many of the remaining 305 members of the class indicate that they are about to change their minds.
CHURCH PREFERENCES
Baptist Christian Christian Science Congregational Dutch Reformed Episcopal Ethical Culture Jewish Lutheran
1932 1931 27 23 5 4 20 18 114 144 7 11 106 115 1 0 46 43 8 12
Methodist Presbyterian Roman Catholic Unitarian Universalist Miscellaneous No Preference Total
1932 1931 49 39 94 96 54 70 25 30 6 8 6 7 18 6 586 626
Probably on account of the coming election Congregationalists and Roman Catholics reach a new minimum in this class, the former 31 less than the average for the last eight years and the Roman Catholics less than for some years. Methodists, however, are apparently having a renaissance, and that group is getting back to normal. Perhaps the writer should explain that the number of heathen (no preference) probably depends almost entirely on how vigorously the clerk at registration tries to get each man to give some sort of church preference. As usual I will avoid trouble with both Jew and Gentile by not referring to the number of boys of Jewish faith in the entering class, as this number of course has no possible significance.
COLLEGE TRAINING OF PARENTS
Sons of Dartmouth Alumni College Trained Fathers Number of Colleges—Fathers College Trained Mothers Number of Colleges—Mothers Both Parents College Bred
19323618385693738
19314518078714949
It is rather significant (I have avoided this word successfully up to this point) that there are considerably more sons of college men in this class than in any other entering class. After Dartmouth the ranking colleges are Columbia with 9 boys in the class, Harvard 8, Michigan 7, and M. I. T., C. C. N. Y. and Penn 5. Among the mothers Wellesley leads with 10, Smith 9 and Oberlin 5. The shrinkage in sons of Dartmouth Alumni is, frankly, because of the fact that the problem of choosing a small class from an application list of most promising material necessitated the refusal of quite a few sons of alumni.
SCHOOL REPRESENTATION
19321931
No. ofSchools317346
Public235242
Private82104
No. fromPublic371363
No. fromPrivate215 262
The writer was surprised to note that the number of schools represented in this class, and especially the number of private schools, is somewhat smaller. The striking fact, however, is that the number of boys entering direct from high school in the class of 1932 is, in view of the size of the class, decidedly large. For fear that someone will be disappointed I must add, as usual, that the above table indicates the real strength of the Dartmouth system of admissions.
NUMBER OF STUDENTS FROM A SCHOOL
1 2 3 4 5 6 7 8 9 10 11 12 13 20 26 1932 205 57 25 12 5 4 1 0 0 0 0 2 0 1 1931 223 64 36 7 6 2 3 0 2 0 1 0 0 1 1
We are sorry to note that the number of schools sending only one boy has dropped from 223, where it has stood for two years, to 205. This is probably symtomatic of changing conditions and cannot be avoided. As usual Exeter leads in the private school group with 26 men in the class. Andover and Deerfield each have sent 13 and Lake Forest Academy 8. Among the public schools Horace Mann and New Trier lead with 7 representatives, followed by Evanston, Manchester Central, New Rochelle and Newton with 6 each. It is clear from the above table that our undergraduate body is probably unique in its representation of a very large number of schools.
METHODS OF ADMISSION
Certificate Examination Examination and Certificate Transfer "Special" Certificate
19324525282 0 299
19315084275 1 338
The percentage of men entering by certificate alone is lower than usual, and consequently more men have presented at least part of their credits by examination. As fewer men than usual have entered from -private schools, this probably means that public schools are becoming more and more careful in their certification to Dartmouth. Apparently the number of "special" certificate men, the method of presenting credits which we prefer, has fallen off this year, but this figure is always inaccurate because of the fact that principals file ordinary certificates for scores of boys who are eligible for special certificates. In fact, in spite of all of our literature many principals still think that special certification is meant for lame ducks who cannot qualify for ordinary certification.
This last sentence reminds me of a very wise remark once made to me in an entirely different connection by one of our senior trustees: "I have often noticed that men seeking special consideration are not worthy of ordinary consideration."
If the writer has the courage next year, he will vary this mail-order store form of article by having the tables arranged to compare the Class of 1933 not with 1932 but with a composite class representing an average perhaps for the last eight years. Such a comparison may mean something but there will be no place for humor in it.