A Survey of Geographical Distribution
Based on the Central States District in 24 American Colleges
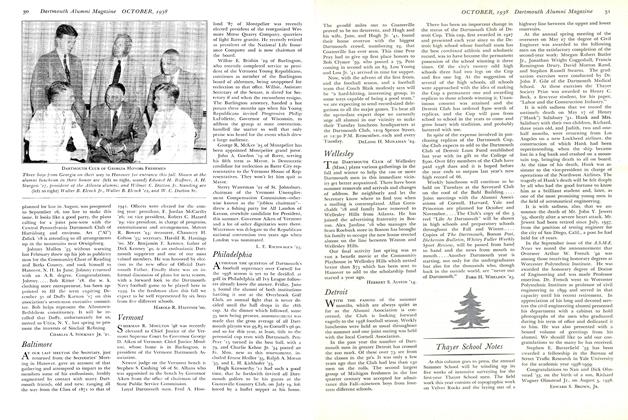
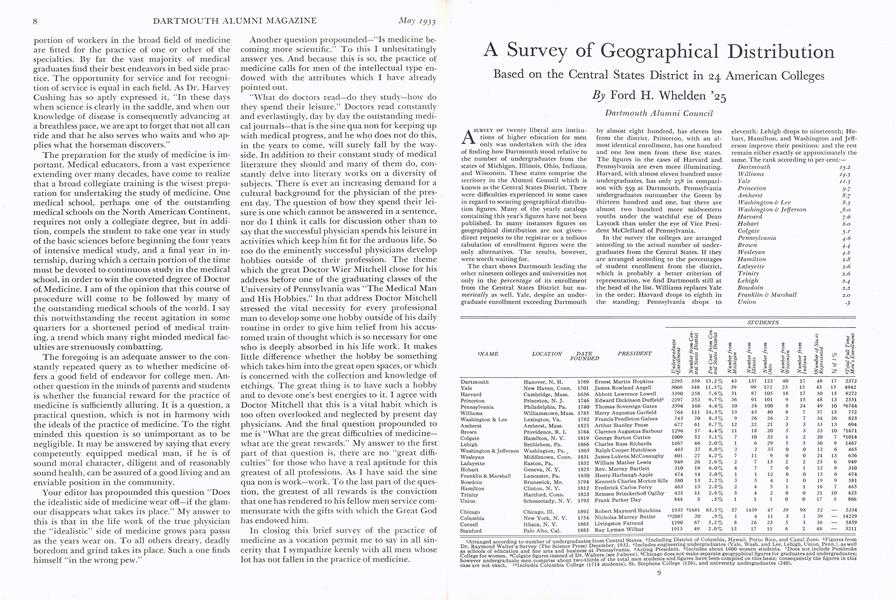
A SURVEY OF twenty liberal arts institutions of higher education for men " only was undertaken with the idea of finding how Dartmouth stood relative to the number of undergraduates from the states of Michigan, Illinois, Ohio, Indiana, and Wisconsin. These states comprise the territory in the Alumni Council which is known as the Central States District. There were difficulties experienced in some cases in regard to securing geographical distribution figures. Many of the yearly catalogs containing this year's figures have not been published. In many instances figures on geographical distribution are not givendirect requests to the registrar or a tedious tabulation of enrollment figures were the only alternatives. The results, however, were worth waiting for.
The chart shows Dartmouth leading the other nineteen colleges and universities not only in the percentage of its enrollment from the Central States District but numerically as well. Yale, despite an undergraduate enrollment exceeding Dartmouth by almost eight hundred, has eleven less from the district. Princeton, with an almost identical enrollment, has one hundred and one less men from these five states. The figures in the cases of Harvard and Pennsylvania are even more illuminating. Harvard, with almost eleven hundred more undergraduates, has only 258 in comparison with 359 at Dartmouth. Pennsylvania undergraduates outnumber the Green by thirteen hundred and one, but there are almost two hundred more midwestern youths under the watchful eye of Dean Laycock than under the eye of Vice President McClelland of Pennsylvania.
In the survey the colleges are arranged according to the actual number of undergraduates from the Central States. If they are arranged according to the percentages of student enrollment from the district, which is probably a better criterion of representation, we find Dartmouth still at the head of the list. Williams replaces Yale in the order; Harvard drops to eighth in the standing; Pennsylvania drops to eleventh; Lehigh drops to nineteenth; Hobart, Hamilton, and Washington and Jefferson improve their positions; and the rest remain either exactly or approximately the same. The rank according to per cent: DartmouthWilliamsYalePrincetonAmherstWashington if LeeWashington if JeffersonHarvardHobartColgatePennsylvaniaBrownWesleyanHamiltonLafayetteTrinityLehighBowdoinFranklin if MarshallUnion15.214.311.39.78.78.38.07.66.05.14.64.44.22.82.62.62.42.22.0 3
STUDENTS
INAME Dartmouth Yale Harvard Princeton Pennsylvania Williams Washington & Lee Amherst Brown Colgate Lehigh Washington & Jefferson Wesleyan Lafayette Hobart Franklin & Marshall Bowdoin Hamilton Trinity Union Chicago Columbia Cornell Stanford
LOCATION Hanover, N. H. New Haven, Conn. Cambridge, Mass. Princeton, N. J. Philadelphia, Pa. Williamstown, Mass. Lexington, Va. Amherst, Mass. Providence, R. I. Hamilton, N. Y. Bethlehem, Pa. Washington, Pa. Middletown, Conn. Easton, Pa. Geneva, N. Y. Lancaster, Pa. Brunswick, Me. Clinton, N. Y. Hartford, Conn. Schenectady, N. Y. Chicago, III. New York, N. Y. Ithaca, N. Y. Palo Alto, Cal.
DATEFOUNDED 1769 1701 1636 1746 1740 1785 1782 1825 1764 1819 1866 1865 1831 1832 1825 1850 1794 1812 1823 1795 1892 1754 1865 1885
PRESIDENT Ernest Martin Hopkins James Rowland Angell Abbott Lawrence Lowell Edward Dickinson Duffield5 Thomas Sovereign Gates Harry Augustus Garfield Francis Pendleton Gaines Arthur Stanley Pease Clarence Augustus Barbour George Barton Cutten Charles Russ Richards Ralph Cooper Hutchison James Lukens McConaughy William Mather Lewis Rev. Murray Bartlett Henry Harbaugh Apple Kenneth Charles Morton Sills Frederick Carlos Ferry Remsen Brinckerhoff Ogilby Frank Parker Day Robert Maynard Hutchins Nicholas Murray Butler Livingston Farrand Ray Lyman Wilbur
Undergraduate 4Enrollment 2295 3069 3390 2297 3596 764 743 677 1296 1009 1467 465 601 949 310 674 580 463 425 844 1935 102087 1290 1913
Number from Central States Dostioct 359 348 258 252 166111 70 61 57 52 46 37 27 26 19 14 13 13 11 3 91681 20 67 49
Per Cent from Central States District 15.2% 11.3% 7.6% 9.7% 4.6% 14.3% 8.3% 8.7% 4.4% 5.1% 2.0%8.0% 4.2% 2.6% 6.0% 2.0%2.2%2.8%2.6% .3% 83.5% .9% 5.2% 2.0%
Number from Michigan 43 39 31 36 10 13 9 1211 7 1 2 7 2 4 1 3 2 5 1 57 1 8 13
Number from Illinois 137 99 87 91 24 43 26 22 1810 6 2 11 7 7 1 5 4 4 1 1439 4 26 17
Number from Ohio 122 172 105 101 100 40 26 21 20 32 29 33 9 13 7 12 4 5 2 1 47 11 25 11
Number from Wisconsin 40 23 18 9 8 8 2 3 5 1 5 0 0 2 0 0 1 1 0 0 39 3 5 6
Number from Indiana 17 15 17 15 24 7 7 3 3 2 5 0 0 2 1 0 0 1 0 0 98 1 3 2
2Number of Staes Represented 48 45 50 48 49 37 34 33 33 20 30 12 24 23 12 15 19 16 21 17 52 39 36 44
3/4 of 1% 17 15 15 13 10 15 26 13 10 7 9 6 13 6 9 6 9 7 10 5
3Total full time Men's Enrollment 2372 4942 8272 2551 66764 772 823 694 71671 81014 1467 465 636 949 310 674 581 465 425 866 5334 14229 5859 3211
If we examine the statistics for the individual states we find Dartmouth at the head of the list numerically in Michigan, Illinois, and Wisconsin; second to Yale in Ohio, and in back, of Pennsylvania in Indiana. In per cent Yale would just manage to hold its place in Ohio but Dartmouth would top Pennsylvania in Indiana. After even a cursory examination of the figures it is certainly apparent that as far as the Central States are concerned, Dartmouth in this field of twenty colleges for men only is right at the top of the list.
A few words as to geographical distribution for the entire country. The true test of nation-wide representation is certainly not the number of states represented. A single undergraduate from a state is all well and good, but the real advantage will come when a state or a portion of the country is represented in sufficient numbers to make its influence and its personality felt by the entire group. In order to figure out these statistics it was necessary to arbitrarily set a certain per cent and work from that. The writer felt that in 34 of 1% seemed a sound figure. In other words, in a college of 2000, fifteen men (¾ of 1%) would exert sufficient influence on their fellows to justify calling that number a good representation from that state. Taking this as our "common denominator" and tabulating the results for the twenty colleges we find Dartmouth leading all but Washington and Lee. The latter stands out head and shoulders above the field. Although represented by only thirty-six states against Dartmouth's forty-eight, we find that our southern friend has twentysix of those states in the three-quarters of one per cent class against Dartmouth's seventeen. The rest of the field ranges from Harvard, Yale, and Williams with fifteen states to a low of five in the case of Union. In this section of the survey our own pride will have to be mingled with a rousing cheer for Washington and Lee.
The survey of these twenty men's colleges is supplemented by similar figures on four universities which, although co-educational, are so akin to Dartmouth in many respects that it was thought wise to include them. All have ideals similar to ours, all are our close and respected friends, and all have been or are our friendly rivals on the athletic field. Probably the most striking fact brought out in statistics on these institutions is the fact that as far as men undergraduates are concerned, Dartmouth is larger than any of them. It is surprising to find that Dartmouth, as far as the undergraduate enrollment of men is con- cerned, is larger than Columbia, Cornell, Chicago, or Stanford. The notion that Dartmouth is a small college hangs on even among ourselves, but it is far from a fact. More undergraduate men at Dartmouth from Ohio and Wisconsin than at the University of Chicago—it seems hard to believe. More than seventeen times as many men from the Central States districts at Dartmouth than at Columbia College. And over five times as many in comparison with the undergraduate men at Cornell—which is next door to Ohio and the Central States.
Vox Clamantis in Deserto!—and the call is heard and answered from the region of the Great Lakes.
Dartmouth Alumni Council
1 Arranged according to number of undergraduates from Central States. 2Including District of Columbia, Hawaii, Porto Rico, and Canal Zone. 3Figures from Dr. Raymond Survevy (The Science Press) December, 1932. includes engineering undergraduates (Yale, Wash, and Lee, Lehigh, Union, Penn.), as well as schools of education and fine arts and buSS at Pennsylvania. 5Acting President. 6Includes about 1600 women students. 'Does not include Pembroke College for women 8colgate figures instead of Dr. Walters (see 3 above). 9Chicago does not make separate geographical figures for graduates and undergraduates; men comprise two-thirds of the total men students and figures have been compiled on this basis; consequently the figures in this case are exact. College (1714 students). St. Stephens College (126), and university undergraduates (240).