Class Achievements, '52 Alumni Fund
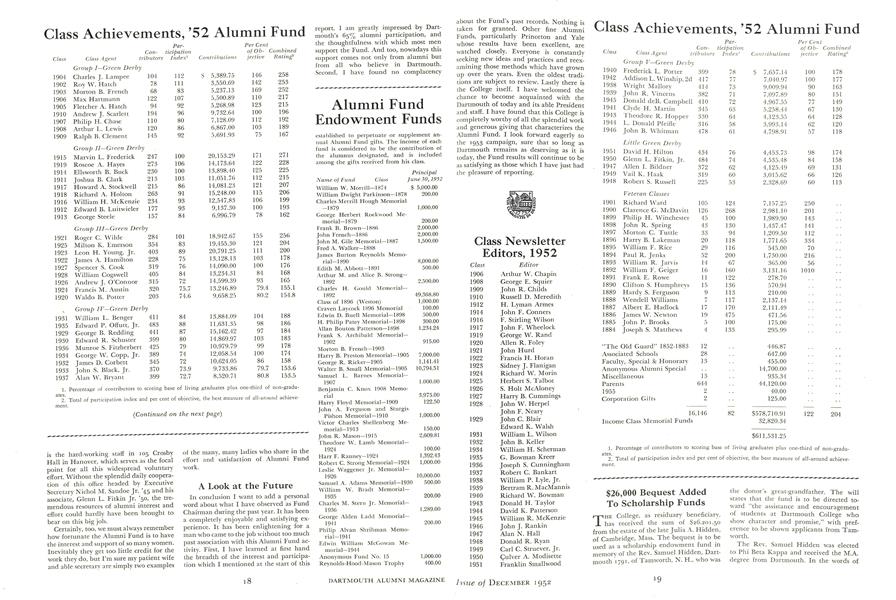
Par- Per CentCon- ticipation of Ob- CombinedClass Class Agent tributors Index1 Contributions jective Rating2Group I—Green Derby 1904 Charles J. Lampee 104 112 $ 5,389.75 146 258 1902 Roy W. Hatch 78 111 3,550.69 142 253 1903 Morton B. French 68 83 5,237.13 169 252 1906 Max Hartmann 122 107 5,500.89 110 217 1905 Fletcher A. Hatch 94 92 5,268.98 123 215 1910 Andrew J. Scarlett 194 96 9,732.64 100 196 1907 Philip H. Chase 110 80 7,128.09 112 192 1908 Arthur L. Lewis 120 86 6,867.00 103 189 1909 Ralph B. Clement 145 92 5,691.93 75 167 Group 11—Green Derby 1915 Marvin L. Frederick 247 100 20,153.29 171 271 1919 Roscoe A. Hayes 273 106 14,173.64 122 228 1914 Ellsworth B. Buck 230 100 13,898.40 125 225 1911 Joshua B. Clark 213 103 11,051.76 112 215 1917 Howard A. Stockwell 215 86 14,081.23 121 207 1918 Richard A. Holton 263 91 15,248.00 115 206 1916 William H. McKenzie 234 93 12,547.83 106 199 1912 Edward B. Luitwieler 177 93 9,137.30 100 193 1913 George Steele 157 84 6,996.79 78 162 Group lll—Green Derby 1921 Roger C. Wilde 284 101 `18,942.67 155 256 1925 Milton K. Emerson 354 83 19,455.30 121 204 1923 Leon H. Young, Jr. 403 89 20,791.25 111 200 1922 Tames A. Hamilton 228 75 13,128.13 103 178 1927 Spencer S. Cook 319 76 14,090.00 100 176 1928 William Cogswell 405 84 13,234.31 84 168 1926 Andrew J. O'Connor 315 72 14,599.39 93 165 1924 Francis M. Austin 320 75.7 13,246.89 79.4 155.1 1920 Waldo B. Potter 203 74.6 9,658.25 80.2 154.8 Group IV—Green Derby 1931 William L. Benger 411 84 13,884.09 104 188 1935 Edward P. Offutt, Jr. 483 88 11,631.35 98 186 1929 George B. Redding 441 87 15,162.42 97 184 1930 Edward R. Schuster 399 80 14,869.97 103 183 1936 Munroe S. Fitzherbert 425 79 10,979.79 99 178 1934 George W. Copp, Jr. 389 74 12,058.54 100 174 1932 Tames D. Corbett 345 72 10,624.05 86 158 1933 John S. Black, Jr. 370 73.9 9,733.86 79.7 153.6 1937 Alan W. Bryant 399 72.7 8,520. /1 80.8 153.5 1. Percentage of contributors to scoring base of living graduates plus one-third of non-graduates 2. Total of participation index and per cent of objective, the best measure of all-around achievement ment.
Par- Per CentCon- ticipation of Ob- CombinedClass Class Agent tribntors Index1 Contributions jective Rating2Group V—Green Derby 1940 Frederick L. Porter 399 78 S 7,657.14 100 178 1942 Addison L.Winship, 2d 417 77 7.040.97 100 177 1938 Wright Mallory 414 73 9,009.94 90 163 1939 John R. Vincens 382 71 7,097.89 80 151 1945 Donald deB. Campbell 410 72 4,967.55 77 149 1941 Clyde H. Martin 345 63 5,258.44 67 130 1943 Theodore R. Hopper 330 64 4,123.55 64 128 1944 L. Donald Pfeifle 316 58 3,993.14 62 120 1946 John B. Whitman 478 61 4,798.91 57 118 Little Green Derby 1951 David H. Hilton 434 76 4,453.73 98 174 1950 Glenn L. Fitkin, Jr. 484 74 4,535.48 84 158 1947 Allen I. Bildner 372 62 4,125.49 69 131 1949 Vail K. Haak 319 60 3,015.62 66 126 1948 Robert S. Russell 225 53 2,328.69 60 113 Veteran Classes 1901 Richard Ward 105 124 7,157.25 250 1900 Clarence G. McDavitt 126 268 2,981.10 201 1899 Philip H. Winchester 45 100 1,989.90 143 1898 John R. Spring 43 130 1,437.47 141 1897 Morton C. Tuttle 33 94 1,209.50 112 1896 Harry B. Lakeman 20 118 1,771.65 334 1895 William F. Rice 29 116 545.00 70 1894 Paul R. Jenks 52 200 1,730.00 216 1893 William R. Jarvis 14 67 365.00 56 1892 William F. Geiger 16 160 3,131.16 1010 1891 Frank E. Rowe 11 122 278.70 1890 Clifton S. Humphreys 15 136 570.94 1889 Hardy S. Ferguson 9 113 210.00 1888 Wendell Williams 7 117 2,137.14 1887 Albert E. Hadlock 17 170 2,111.49 1886 James W. Newton 19 475 471.56 1885 John P. Brooks 5 100 175.00 1884 Joseph S. Matthews 4 133 295.99 "The Old Guard" 1852-1883 12 . . 446.87 Associated Schools 28 . . 647.00 Faculty, Special & Honorary 13 . . 455.00 Anonymous Alumni Special . . . . 14,700.00 Miscellaneous 13 . . 935.34 Parents 644 . . 44,120.00 1955 2 . . 40.00 Corporation Gifts 2 . . 125.00 16,146 82 $578,710.91 122 204 Income Class Memorial Funds 32,820.34 5611,531.25 1. Percentage of contributors to scoring base of living graduates plus one-third of non-gradu- ates. 2. Total of participation index and per cent of objective, the best measure of all-around achieve- ment.