THE CLASS OF 1936
I BELIEVE THE CLASS OF 1936 is the best class yet admitted to Dartmouth under the Selective Process. This does not mean that I think it will have the highest scholastic average necessarily, but rather that it contains in fullest measure all those elements of strength and potentiality which the Selective Process was designed to emphasize and which should make for a strong community life on the Dartmouth campus.
Having been foolish enough to make the above statement, I can now sit back and watch paper analyses of character and promise disintegrate.
As usual I shall compare the class of 1936 statistically to a composite or average class formed from the previous classes admitted under the Selective Process—in this case ten in number. The figures are just accurate enough to be interesting. By a strange coincidence, the class of 1936 is almost exactly average in numbers, containing 637 as compared with 633. Consequently all statistics are immediately comparable without any elaborate mathematical calculations.
It has been indicated many times that the size of our freshman class is determined so that the undergraduate college shall not exceed 2,300 men. This year the Director of Admissions was instructed to admit 650 men, and the freshman class of 637, together with six upperclass transfers, just about does the trick. In this outlandish year when even statistics sometimes tell the truth, it was a hard job to guess what percentage of selected men would eventually turn up. Of course the number selected had to be greatly in excess of the number wanted, but no previous shrinkage formulas could be used. As a matter of fact, a score of boys who had been notified in the summer that no scholarship aid was available for them but who had continued to hope until the last second that a local loan, Santa Claus, or some Fairy Godmother would arrive in time, did not notify this office of their final failure to make ends meet until their class was in process of registration. But all is well that ends well and the undergraduate college this year at the time of writing is 2294, as compared with 2298 last year.
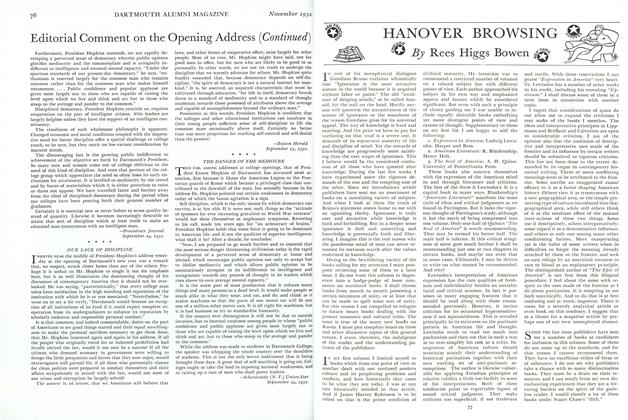
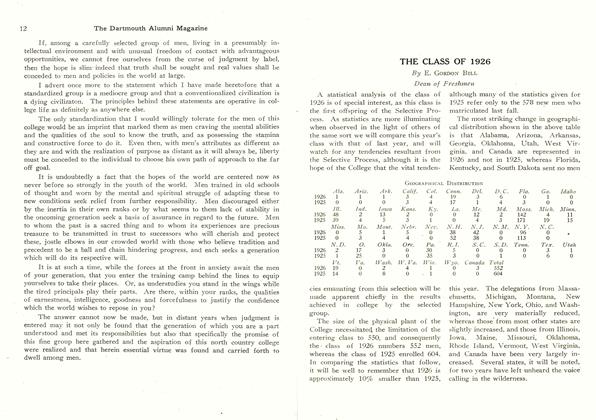
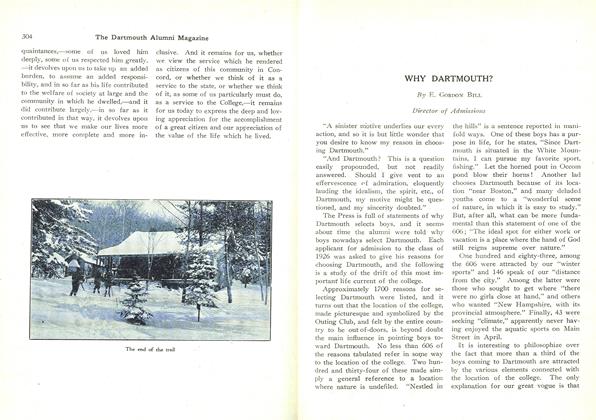
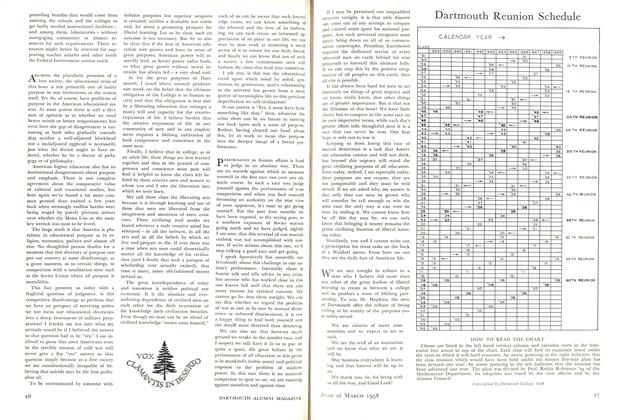
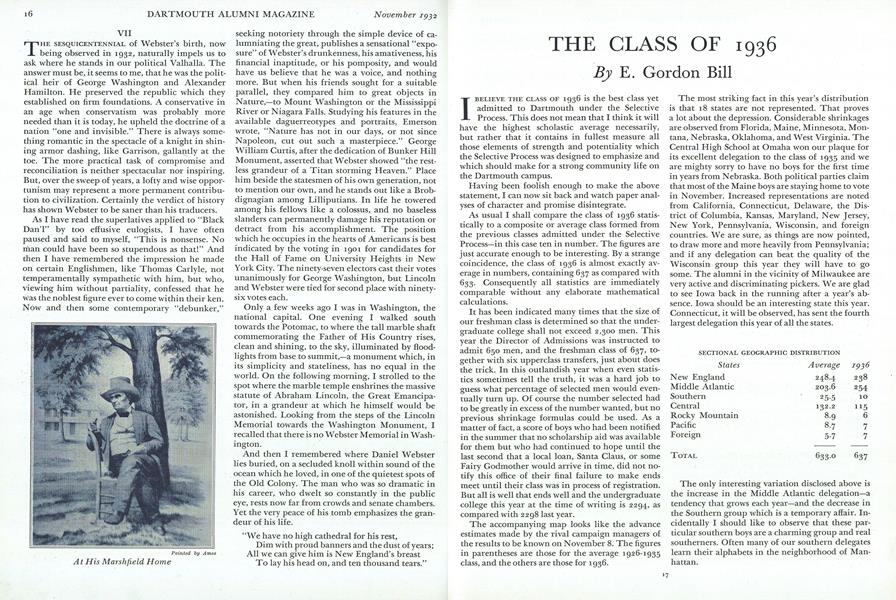
The accompanying map looks like the advance estimates made by the rival campaign managers of the results to be known on November 8. The figures in parentheses are those for the average 1926-1935 class, and the others are those for 1936.
The most striking fact in this year's distribution is that 18 states are not represented. That proves a lot about the depression. Considerable shrinkages are observed from Florida, Maine, Minnesota, Montana, Nebraska, Oklahoma, and West Virginia. The Central High School at Omaha won our plaque for its excellent delegation to the class of 1935 and we are mighty sorry to have no boys for the first time in years from Nebraska. Both political parties claim that most of the Maine boys are staying home to vote in November. Increased representations are noted from California, Connecticut, Delaware, the District of Columbia, Kansas, Maryland, New Jersey, New York, Pennsylvania, Wisconsin, and foreign countries. We are sure, as things are now pointed, to draw more and more heavily from Pennsylvania; and if any delegation can beat the quality of the Wisconsin group this year they will have to go some. The alumni in the vicinity of Milwaukee are very active and discriminating pickers. We are glad to see lowa back in the running after a year's absence. lowa should be an interesting state this year. Connecticut, it will be observed, has sent the fourth largest delegation this year of all the states.
SECTIONAL GEOGRAPHIC DISTRIBUTION
States Average 1936 New England 248.4 238 Middle Atlantic 203.6 254 Southern 25.5 10 Central 132.2 115 Rocky Mountain 8.9 6 Pacific 8.7 7 Foreign 5.7 7 TOTAL 633.0 637
The only interesting variation disclosed above is the increase in the Middle Atlantic delegation—a tendency that grows each year—and the decrease in the Southern group which is a temporaryffair. Incidentally I should like to observe that these particular southern boys are a charming group and real southerners. Often many of our southern delegatelearn their alphabets in the neighborhood of Manhattan.
FAVORED GROUPS
Average 1936 Alumni 38.8 43 New Hampshire 40.7 32 West of Mississippi 51.9 30 South of Ohio and Potomac 19.6 10 Foreign 5.7 7 TOTAL J 56-7 122
The alumni group, which continues to be prolific, and the foreign student group show small increases. The other groups for fairly obvious reasons show a considerable shrinkage.
Incidentally, I have already interviewed all the representatives of these groups and they certainly are a magnificent lot of boys. I have often kidded the alumni about their average sons, but I venture to prophesy that no group of 43 men can be picked from this class that after four years will have a better record of all-round accomplishment than these sons of alumni. The average year of graduation of the
fathers—who probably had some small part in establishing the quality of these boys—is 1906, and yetonly one son of 1906 is in this class. On the other hand, no less than 11 sons of 1910 men are in the 43. The oldest class represented is 1887 and the youngest, with the exception of one stepfather, is 1913. The students from foreign countries and dependencies are distributed as follows: England 2, Canada 1, Cuba 1, Hawaii 1, Holland 1, and the Dominican Republic 1.
OCCUPATIONS OF FATHERS
I had expected to be able to discard most of the general titles used in past years in this table, but apparently boys are still trying to keep up appearances and call their fathers bankers even when these have been forced to adapt themselves to changed circumstances so diverse as selling vacuum cleaners or lecturing on Economics.
Of course the most interesting statistic above is that whereas we have 14 sons of farmers in the average class, this year there is only one boy who dares admit his father is a farmer. Although disappointed at this economic condition of farmers we are very pleased to note a large increase in the sons of clergymen. Evidently people in periods of melancholy are more willing to pay for their souls' salvation than they are for the wheat that nourishes their bodily needs!
Average 1936 Business 377-2 393 Lawyer 41.0 38 Physician 36.7 37 Artisan 28.7 28 Engineer 29.1 31 Educator 21.8 21 Farmer 14.2 1 Clerk 14.4 11 Civil Service Official 9.6 12 Artist or Author 9.2 12 Army and Navy 0.0 6 Dentist 7.3 8 Journalist 5.8 6 Accountant 6.6 10 Clergyman 6.1 9 Chemist 3.8 5 Miscellaneous 21.6 9 TOTAL 633.0 637 Deceased 44.8 50
We have had to add a brand new category this year—sons of Army and Naval officers, of which there are six in the class, and, incidentally, two of the upperclass transfers are sons of prominent Naval men. The miscellaneous heading covers a multitude of sins containing such items as sons of governors and salesmen of lingerie in women's colleges!
Rather more fathers than usual are dead, but one boy at registration, in answer to the question "Is your father living?" wrote, "Yes, sir!" I hope to meet that particular father.
Just as last year there is an enormous increase in fathers who are trying to sell something and a small decrease in those who are trying to make sommen who are insuring realtors' properties are apparently prosperous. Either our tabulating clerk was confused or else the number of bankers sending us boys is amazingly increased. What has happened to our druggists? Perhaps they are now classified under "hotel and restaurant."
Many know how little I think of the validity of an analysis of vocations planned or considered by members of an entering class. However, last year 265 men planned on business and this year only 198 men indicated such a plan. Last year 11 had considered careers of science, and this year 20 are in that state of mind. Last year 32 men had considered art and literature. This year 50 men indicated this field of endeavor—assuming that journalists are interested in literature. Only 31 men this year are thinking of becoming educators as compared with 45 in the class of 1935.
BUSINESS
Average 1936 Business Executive 122.6 107 Merchant 61.5 103 Manufacturer 45.0 42 Realtor 20.9 12 Salesman 21.1 22 Insurance 19.8 26 Contractor and Builder 16.3 13 Banker 19.4 30 Broker 15.1 14 Hotel and Restaurant 4.9 5 Printer and Publisher 6.1 7 Druggist 3.5 o Advertising 6.8 9 Unclassified 14.2 3 TOTAL 377-2 393
VOCATIONS
Planned Considered Total Business 113 85 198 Lawyer 52 48 100 Physician 65 27 92 Artisan 112 Engineer 37 52 89 Educator 18 13 31 Farmer 134 Clerk 000 Artist or Author 10 16 26 Civil Service Official 213 Dentist 0 5 5 Journalist 7 17 24 Accountant 213 Clergyman 0 33 Scientist 7 13 20 Miscellaneous 4 5 9 TOTAL 319 290 609 None planned or considered 28TOTAL 637
REASONS FOR CHOOSING DARTMOUTH
1. Reasons rather definitely connected with the intellectual reputation of the college
1935 1936 Scholastic Standing 106 79 General Reputation 96 90 Its Graduate Schools 69 53 Its Curriculum 73 69 Standards 28 21 352 312
2. Reasons more definitely personal
Impressions by Alumni and Undergraduates 71 67 Dartmouth Ancestry 27 25 Friend's Advice 17 36 Father's Wish 5 3 Principal's Recommendation 4 5 144 136
3. Miscellaneous reasons
Location and Environment 95 88 Composition of Student Body 19 23 Its Size 19 14 Outdodr Life 4 6 The College Spirit 10 16 Traditions 8 10 Non-coeducational 4 5 Eastern College 8 6 Winter Sports 1 4 Democratic 13 5 Scholarship Aid 1 5 No reason given 10 7 192 189
In making comparisons in the above table, which is interesting although representing hasty and superficial judgments, it should be noted that the class of 1935 numbered 696 as compared with 637 in this class. I really should add another title to the above, "President Hopkins," as each year he is often given as the reason for choosing Dartmouth; but for purposes of condensation we have included him in "General Reputation." One boy chose Dartmouth because of its "difficult entrance requirements," and another because "Latin is not required for entrance nor for an A.B. degree." So there you are!
Congregationalists, Espiscopalians, and Roman Catholics have made the biggest records in this class. Perhaps this is because the staff assisting at registration this year contained some forceful-looking upperclassmen who prevented the boys from writing that they had "no preference." This group had grown so in recent years that I had planned to change the question "What is your religious preference?" to "What religious preference had your maternal grandmother?" But this class indicates only nine heathen as compared with an average of 39. The Jewish delegation, which was 75 last year, is back to normal. We tried to put all of the following in their proper category: Precbeterian, Presybeterian, Presbeteyrian, Espiscapol, Congogational, Congergationalist (probably a snake charmer), and Unartarian.
CHURCH PREFERENCES
Average 1936 Congregational 134.1 141 Episcopal 106.8 130 Presbyterian 92.9 83 Roman Catholic 66.3 79 Methodist 49.9 39 Jewish 36.1 37 Baptist 31.6 26 Christian Scientist 20.7 17 Unitarian 19.0 22 Lutheran 10.0 15 Universalist 6.2 9 Christian 4.2 1 Dutch Reformed 2.9 3 Miscellaneous 12.6 26 No Preference 39.7 9 TOTAL 633.0 637
COLLEGE TRAINING OF PARENTS
Average 1936 Sons of Dartmouth Alumni 38.8 43 College-Trained Fathers 177.0 269 Number of Colleges—Fathers 79.1 95 College-Trained Mothers 70.0 108 Number of Colleges—Mothers 40.8 52 Both Parents College Bred 44.5 90
The percentage of sons of college-trained parents is enormously increased. 269 fathers are college men as compared with an average of 177. Even if some of these fathers were classed by their sons as college men because they failed to get into some college, the increase is striking. College mothers have jumped from 70 to 108; and boys, both of whose parents are college-trained, have more than doubled in numbers. One boy, instead of naming his mother's college, wrote "Some marriageable age."
Michigan fathers sending 13 sons came next to Dartmouth. Next in order were Columbia, Harvard, and Yale fathers with 12 sons each. M. I. T. sent 11; Cornell and the University of Pennsylvania sent seven each; and Wisconsin and Ohio State, six each. Fifteen Smith mothers sent us sons; Wellesley 12 and Vassar eight. One wonders whether graduates of certain other women's colleges have boys, and if so where they go.
SCHOOL REPRESENTATION
No. of No. from No. from No. fromSchools Public Private Public Private Colleges Average 336 240 96 387 242 4 1936 335 222 113 356 281 0
It is interesting to note that the class of 1936 represents 335 schools as compared with an average of 336. The number of private schools represented continued to increase and the percentage of boys from private schools is now 44.1 as compared with an average of 38.2. However, last year 47 per cent of the class came from private schools. This general tendency means, as I have often pointed out, that more boys, when they can afford it, are taking a finishing-off year.
NUMBER OF STUDENTS FROM A SCHOOL
Maxi-1 2 3 4 5 6 7 8,9,10 mumAverage 212.2 66.7 24.0 12.1 7.3 3.8 2.9 6.1 23.0 1936 215.0 60.0 26.0 7.0 9.0 9.0 4.0 5.0 19.0
Two hundred and fifteen schools sent us a single boy. Not much chance of domination in that situation! On the other hand, nine schools sent six representatives each as compared with an average of approximately four such schools. Our maximum delegation this year is 19 as compared with an average maximum of 23.
Among the private schools the largest delegations are as follows: Exeter 19; Deerfield 15; Clark 14; Tabor 11; Andover 10; New Hampton and Mercersburg seven each. Brooklyn Poly Prep, Choate School, and Horace Mann sent us six men each; and five men came from each of the following: Governor Dummer Academy, Lake Forest Academy, Lawrenceville School, Milwaukee Country Day School, the Pawling School, University School of Cleveland, and Worcester Academy.
Public schools as usual sent many and small delegations. The largest ones this year were from the Crosby High of Waterbury (Conn.) and the Ridgewood (N.J.) High with seven each. Bronxville, the Bulkeley School of New London (Conn.), Evanston Township, Montclair (N. J.), New Trier (Winnetka, Ill.) sent six men each; while the Columbia Grammar and Lawrence (Mass.) each sent five men.
AGE OF ENTRANTS
Operating under the firm belief that young and immature boys are in general better fitted for large universities and city colleges than they are for the community life of the Dartmouth campus, the Director of Admissions this year consciously tried to refuse such applicants. This was fairly easy this year as the quality of the material from which selections were made in April was superlative. As the result, the average age of the class—18.15 years—is greater than that of any one of the last five classes. Strangely enough, the first five classes admitted under the Selective Process were all considerably older so that the general average is 18.17 years. It has been hard work in recent years to keep up this average. The oldest man in the class is 26, and the youngest, an "experiment," is 15.
METHODS OF ADMISSION
Average 1936 Certificate 524.0 530 Examination 45.3 58 Certificate and Examination 66.0 49 Honor Certificate 266.4 365 Transfer 4.2 0
The striking fact disclosed above is that 365 men —nearly 60 per cent of the class—entered by honor certificate. A slightly larger number than usual-58 as compared with 45—entered by examination alone, primarily because schools refuse to accept the responsibility of certifying credits.
"JUNIOR SELECTIONS"
Alumni will remember that a year or so ago we announced a new venture in admission—that of selecting a full year in advance a few outstanding boys from good schools. The first of these "Junior Selections" are in the class of 1936. There are 16 of them, nine from public, and seven from private schools, including, incidentally, two sons of alumni. I have interviewed each of these boys and if they are portents of the "Junior Selection" idea, things are looking up. Incidentally, 80 "Junior Selections" have been chosen for the class of 1937, 52 from private and 28 from public schools.
TRANSFERS
Only six upperclass transfers were admitted this year from several hundred applicants, but they look like real Dartmouth men. Last winter the faculty passed a regulation, which the Director of Admissions has been wanting for years, that limits admission of transfers to those men who seem to possess those outstanding qualifications necessary for them to become an integral part of the Dartmouth machine.
EXPERIMENTS
The class of 1936 contains several experiments, whose development interests the Admissions office greatly. For example, I admitted one boy older than the average who had had a miserable four years high school scholastic performance and one year of only fairly good private school accomplishment. I met this man and to me he was full of personality and aggressive leadership and I became convinced that his previous record was due to the home environment and lack of ambition which, when properly aroused in the college, should make him one of the outstanding members of the class.
Another boy was admitted, whose sketchy and somewhat fragmentary credits were generously accepted by the President upon my recommendation, largely for the reason that throughout his course he had shown a surprising lack of docility. He will go far at Dartmouth in one direction or the other, and since meeting him I think it will be toward Olympus.
One boy was admitted because he had such lovely light hair and blue eyes and was about six feet two in height. Our Phi Beta Kappa societies are getting so swarthy that it is well to lighten things up a bit. Another boy was admitted because his mother attended a School of Syncopation during the months just preceding his birth. He should be good.
As usual several men were admitted with open arms from schools which could not hope to secure our certificate privilege. Dartmouth has conclusively proved during these past ten years that when the boy is outstandingly good, his school and his preliminary course can tag along. Our foreign contingent, which usually enters with irregular although highly efficient credits, looks particularly good and interesting.
The registration this year was greatly saddened by the sudden death of a very promising boy from Brooklyn Poly Prep, who died alone in his room before he had registered. He was apparently happily cleaning his trombone at the time death, whose entry nothing could have prevented, seized him.
Geographic Distribution Figures in parentheses for the average 1926-35 class; others for class of 1936.
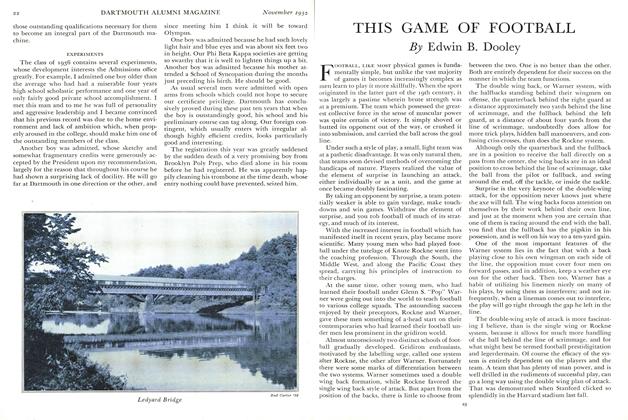
Ledyard Bridge