THE CLASS OF 1926
Dean of Freshmen
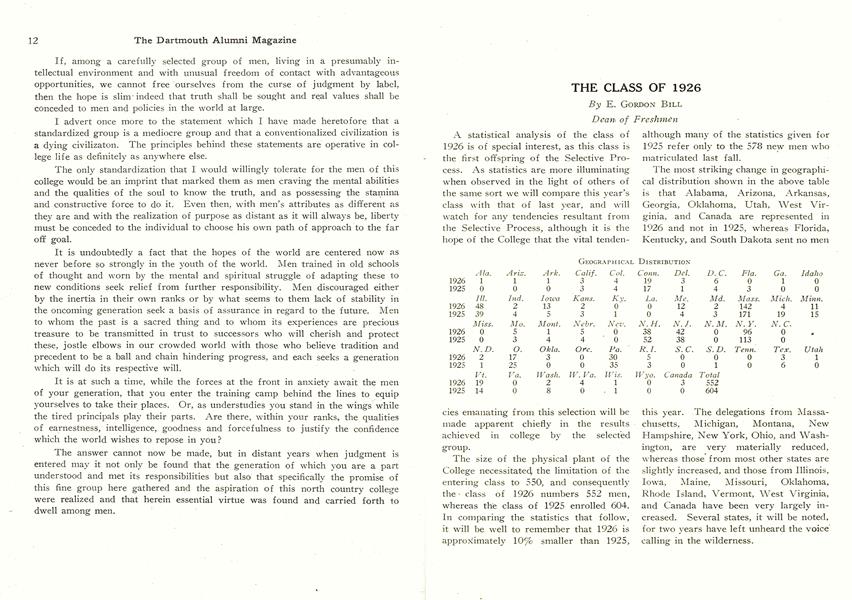
A statistical analysis of the class of 1926 is of special interest, as this class is the first offspring of the Selective Process. As statistics are more illuminating when observed in the light of others of the same sort we will compare this year's class with that of last year, and will watch for any tendencies resultant from the Selective Process, although it is the hope of the College that the vital tendencies emanating from this selection will be made apparent chiefly in the results achieved in college by the selected group.
The size of the physical plant of the College necessitated/ the limitation of the entering class to 550, and consequently the class of 1926 numbers 552 men, whereas the class of 1925 enrolled 604. In comparing the statistics that follow, it will be well to remember that 1926 is approximately 10% smaller than 1925, although many of the statistics given for 1925 refer only to the 578 new men who matriculated last fall.
GEOGRAPHICAL DISTRIBUTION Ala. Ariz. Ark. Calif. Col. Conn. Del. D. C. Fla. Ga. Idaho 1926 1 1 1 3 4 19 3 6 0 1 0 1925 0 0 0 3 4 17 1 4 3 0 0 Ill. Ind. lowa Kans. Ky. La. Me. Md. Mass. Mich. Minn. 1926 48 2 13 2 0 0 12 2 142 4 11 1925 39 4 5 3 1 0 4 3 171 19 15 Miss. Mo. Mont. Nebr. Nev. N.H. N.J. N.M. N.Y. N.C 1926 0 5 1 5 0 38 42 0 96 0 1925 0 3 4 4 ' 0 52 38 0 113 0 N.D. O. Okla. Ore. Pa. R.I. S.C. S. D. Tenn. Tex. Utah 1926 2 17 3 0 30 5 0 0 0 3 1 1925 1 25 0 0 35 3 0 1 0 6 0 Vt. Va. Wash. W. Va. Wis. Wyo. Canada Total 1926 19 0 2 4 1 0 3 552 1925 14 0 8 0 1 0 0 604
The most striking change in geographical distribution shown in the above table is that Alabama, Arizona, Arkansas, Georgia, Oklahoma, Utah, West Virginia, and Canada are represented in 1926 and not in 1925, whereas Florida, Kentucky, and South Dakota sent no men this year. The delegations from Massachusetts, Michigan, Montana, New Hampshire, New York, Ohio, and Washington, are very materially reduced, whereas those from most other states are slightly increased, and those from Illinois, lowa, Maine, Missouri, Oklahoma, Rhode Island, Vermont, West Virginia, and Canada have been very largely increased. Several states, it will be noted, for two years have left unheard the voice calling in the wilderness.
SECTIONAL DISTRIBUTION 1926 1925 New England 235 261 Middle Atlantic 171 187 Southern 21 17 Central 110 120 Rocky Mountain 7 8 Pacific 5 11 Foreign 3 0 Total 552 604
Considering the size of the two classes, it will be seen that the Central, New England, and Rocky Mountain states have remained practically constant in their delegations, whereas the Pacific states have decreased, and the Middle Atlantic, Southern and foreign states have grown. Incidentally, a representation in a backwoods New England college of approximately 20% from the Central States, and a New England representation of under 43%, are certainly noteworthy features of our geographical distribution.
OCCUPATIONAL DISTRIBUTION 1926 1925 Business 372 391 Civil Service 13 13 Clergy 8 8 Doctor 32 43 Educator 16 18 Engineer 18 15 Farmer 13 25 Lawyer 40 42 Miscellaneous 10 6 Deceased 30 17 Total . 552 578
The strangest result seen from this tabulation is that, although the Selective Process definitely aimed to favor sons of farmers, there is a considerably smaller percentage of such boys in 1926 than in 1925. We shall have to blame the new tariff.
For purposes of comparison another year, it may be said that the 372 business men referred to above are occupied as follows: Bankers, 16; Insurance and Real Estate, 31; Manufacturers, 51; Merchants, 63; Miscellaneous, 211. The ten fathers referred to as miscellaneous, consist of Army, 1; Artists, 3 ; Congressmen and Senators, 4; Editors, 2.
CHURCH PREFERENCES 1926 1925 Baptist 36 37 Roman Catholic 47 47 Christian 7 3 Christian Science 27 19 Congregational 138 149 Episcopal 106 106 Jewish 11 12 Lutheran 8 7 Methodist 23 53 Presbyterian 75 72 Reformed 0 6 Unitarian 16 20 Universalist 12 10 Dutch Reformed 3 0 Ethical Culture 2 0 Union 2 0 Church of Divine Science 0 1 Evangelical Protestant 0 2 Protestant 0 11 United Brethren 0 1 Unity 0 1 No Preference 39 21 Total 552 578
The most striking feature in the above comparison is the uniformity with which the two classes express their church preference, although for some reason Dartmouth has apparently lost its appeal to the followers of John Wesley. This is not a conscious tendency of the Selective Process. The press will probably comment on the fact that the percentage of exponents of the Jewish religion is almost identically the same in the class which entered according to priority of application, and that which entered by the Selective Process.
COLLEGE TRAINING OF PARENTS 1926 1925 Sons of Dartmouth Alumni 34 34 College Fathers 147 119 No. of Colleges 74 80 College Mothers 54 53 No. of Colleges 32 28 Both Parents College Bred 31 38
Strangely enough, the same number of sons of alumni, 34, entered with 1926 and 1925, which means that the alumni are doing slightly better.
For 1925 the "honor" institutions in sending us,,grandsons were Boston University, 8; Yale, 6; M. I. T., 5, and Michigan, 5. This year the ranking institutions are Columbia, 9; Boston University, 6; Tufts, 5; Yale, 4. In 1925 there were 7 boys whose fathers were graduates of foreign universities, and in 1926 there are 10 such. Smith and Wellesley again bear off the honors for mothers sending boys to Dartmouth. In 1925, Smith graduates entered 7 boys, and Wellesley 6, and in 1926, Smith sends 10 and Wellesley 7.
It had been prophesied that the Selective Process would result in a larger percentage of boys entering for the A B. course. As a matter of fact, this is so, but to a very small degree. In the class of 1926, 36.2% are candidates for the A. B. degree, as compared with 34.8% in the class of 1925. In this connection interested alumni may remember that the only difference between the A. B. and B. S. courses, essentially, is that for the A. B. degree a boy must take some Latin, and for the B. S. he must take some Mathematics.
METHODS OF ADMISSION 1926 1925 Certificate 468 462 Examinations 24 32 Examinations and Certificate 60 84 "Special Certificate" 154 112 Without Conditions ' 397 334 Maximum Conditions 26 32
Perhaps the outstanding feature of the operation of the Selective Process is that 154 boys entered in 1926 by "Special Certificate," as a result of having graduated in the highest quarter of their classes, after a four year's continuous course in an approved school. The class of 1925 entered only 112 such boys. Dartmouth is very definitely seeking boys who may enter by this "Special Certificate." It should be noted also that, whereas only 76% of the class of 1925 entered by certificate alone, 85% of the class of 1926 entered by this means. In other words, the Selective Process is resulting, as we hoped, in getting more boys whom the schools are willing to stand back of.
It will be further observed that a very much larger percentage of 1926 entered free of conditions than was the case with 1925, but in this connection I would again emphasize the fact that Dartmouth sees no inherent virtue in admission without' condition. The fact that with thousands of boys to choose from, we selected 26 boys with the maximum amount of conditions shows that our Selective Process contemplates other factors and virtues in prospective Dartmouth material than an ability to choose a pre-college environment that will assure either effective tutors, or a continuous schooling in an institution designed to meet our special requirements in entrance units.
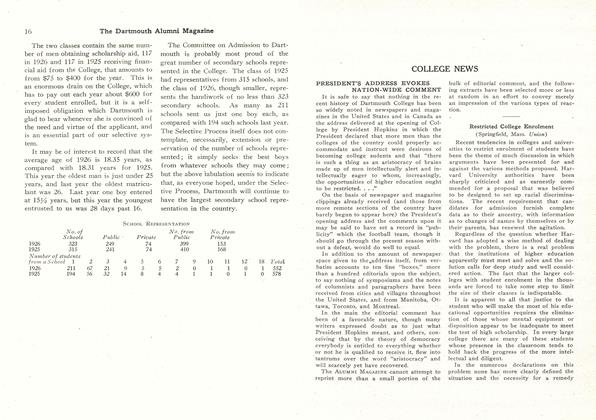
The two classes contain the same number of men obtaining scholarship aid, 117 in 1926 and 117 in 1925 receiving financial aid from the College, that amounts to from $75 to $400 for the year. This is an enormous drain on the College, which has to pay out each year about $600 for every student enrolled, but it is a selfimposed obligation which Dartmouth is glad to bear whenever she is convinced of the need and virtue of the applicant, and is an essential part of our selective system.
It may be of interest to record that the average age of 1926 is 18.35 years, as compared with 18.31 years for 1925. This year the oldest man is just under 25 years, and last year the oldest matriculant was 26. Last year one boy entered at 15y2 years, but this year the youngest entrusted to us was 28 days past 16.
The Committee on Admission to Dartmouth is probably most proud of the great number of secondary schools represented in the College. The class of 1925 had representatives from 315 schools, and the class of 1926, though smaller, represents the handiwork of no less than 323 secondary schools. As many as 211 schools sent us just one boy each, as compared with 194 such schools last year. The Selective Process itself does not contemplate, necessarily, extension or preservation of the number of schools represented; it simply seeks the best boys from whatever schools they may come; but the above tabulation seems to indicate that, as everyone hoped, under the Selective Process, Dartmouth will continue to have the largest secondary school representation in the country.
SCHOOL REPRESENTATION No. of No. from No. fromSchools Public Private Public Private 1926 323 249 74 399 153 1925 315 241 74 410 168 Number of students from a School 1 2 3 4 5 6 7 9 10 11 12 18 Total 1926 211 67 21 9 5 5 2 0 1 1 0 1 552 1925 194 56 32 14 8 4 4 1 1 0 1 0 578
More From This Issue
-
 Article
PRESIDENT'S ADDRESS EVOKES NATION-WIDE COMMENT
November 1922 -
 Article
AN ARISTOCRACY OF BRAINS
November 1922 -
 Article
It is hardly to be conceived that a magazine devoted primarily
November 1922 -
 Class Notes
CLASS OF 1911
November 1922 -
Class Notes
CLASS OF 1911
November 1922 -
 Article
FOOTBALL
November 1922