About Money
The budget • the Campaign for Dartmouth
Financial factors have been so dominant that I have chosen to describe them first in this report. In my five-year report I noted that while the 1960s were being referred to as the "golden age of higher education," the first half of the seventies presented serious financial problems. These financial problems became even more severe in the second half of the decade. The wish that I expressed in my earlier report, to have at least one year without financial worries, never came true.
Inflation at. an extremely high level continued. After a quadrupling of oil prices we had a brief period during which these prices leveled off, but we are now again faced with uncontrolled rises in the price of imported oil. The most important good news we have had in recent years is that, under the outstanding leadership of Paul Paganucci '53, our investments have had a spectacular performance for the past two and a half years. Per- formance was excellent in absolute terms and well above market averages. However, this performance has not so far been enough to make up for the severe losses during the terrible stock market of the mid-seventies. We will need full success of the Campaign for Dartmouth to restore the endowment to its historic level of support of the overall budget. And double-digit, inflation may even undercut that goal.
I refer the reader to the analysis of the causes of financial problems given in the five-year report. They are still applicable. In this report, I have decided to let the numbers speak for themselves.
First of all, with the help of the treasurer, I have updated the charts from the five-year report. They now show the division of gross expenses and gross revenues in major categories for three time periods: ten years before I took office, the year I took office, and the current fiscal year. I want to use these charts to illustrate several remarks concerning the distribution of expenses. A dis- cussion of revenues appears in following pages.
There have been three significant changes in the "share of the pie during the past two decades. Instruction and research has risen from 35 per cent to 46 per cent of the total, while there have been major decreases in administration (from 17.2 per cent to 12.6 per cent) and in auxiliary activities (from 24.4 per cent to 14.1 per cent). Surely this shows that the institution had its priorities in the right place during the past two decades.
Particularly fascinating is the significant decrease in ad- ministrative expenses (including student services). The relative share of administrative expenses has declined by more than one- quarter. I find this fascinating in view of the general conviction on campus that our administrative expenses have gone totally out of control. (I'll have more to say on this subject elsewhere in the report.) These charts show the fallacy in the usual campus presentations. The central administration deals with the entire in- stitution. Therefore, simple-minded calculations such as dividing the total number of administrators by the number of un- dergraduate students totally overlooks the diverse responsibilities of the central administration. For example, it overlooks the fact that the major growth in the Medical School has had a significant impact on the burden the central administration must carry. This increased burden is particularly noticeable for the offices of the president, financial administration, and development. While it is common rhetoric to complain about the growth of the ad- ministration, senior administrative officers feel an enormous in- crease in their workload today as compared with a decade ago. Perhaps these budget comparisons will show that there is justice in those complaints.
I am equally pleased with the significant decline in the share that auxiliary activities command. Their 24.4 per cent share of the budget 20 years ago was much too high to be healthy for the institution. The other parts of the institution have roughly main- tained their relative position. The apparent decline in athletics is misleading in that it is associated entirely with the undergraduate college. We get a better view of its position in the table below. Because of the enormous impact of the Medical School on growth rates, I opted in my five-year report to exclude it from the table presenting percentage growth. I shall do so again.
Budget Growth Rates (Excluding Medical School) Annual Annual First Second Increase Increase five five 60-70 70-80 years years EXPENSE Instruction & Research 11.5% 7.9% 7.5% 8.3% Libraries 11.2 8.9 10.0 7.8 Kiewit, Hopkins Center, 45.8 8.6 9.8 7.1 Tucker Foundation Administration, Student 9.3 7.9 8.4 7.4 Services Athletics 8.0 8.7 8.8 8.6 Plant 9.4 9.3 9.7 9.0 Financial Aid 11.5 7.9 4.6 11.3 Auxiliary Activities 7.1 7.1 7.4 6.9 TOTAL 10.5% 8.0% 7.9% 8.1% REVENUE Student Fees 7.5% 10.3% 11.6% 9-0% Endowment Utilized 14.3 5.3 6.4 4.1 Alumni Fund 17.5 9.5 13-8 5-3 Gifts for Current Use 14.3 4.2 (0.7) 9-3 Sponsored Activities 18.0 5.0 0.0 10.2 Auxiliary Activities 7.1 7.5 7.5 7.4 Other Direct Revenue 9-4 11.0 11.0 11.0 TOTAL 10.5% 8.0% 8.2% 7.9%
The single most startling comparison in this table is the overall annual growth rate in the sixties versus that in the seventies. Dur- ing the sixties, the budget grew at 10.5 per cent per year. There was relatively little expansion in the student body in this decade, and inflation ran at a 3 per cent rate. Therefore, there was enor- mous real growth in the per-student expenditures. It was indeed a golden age. In contrast, the growth in the seventies has only been at an 8 per cent rate in spite of a major expansion in the student body and very high inflation rates. When one corrects for infla- tion and for expansion, it becomes clear that the per-student ex- penditures have declined markedly. In part this has been due to the efficiency of year-round operation, but it also represents con- siderable belt-tightening.
I have presented the growth rates both for the entire decade and for the two half-decades because there are some noticeable differences between the first and second five-year periods. As one looks at the figures, one can't help being distressed by the fact that the highest growth rate has been in "plant." This, of course, reflects the enormous growth in the cost of energy. Indeed, when one takes into account the significant new physical facilities that were added as a result of the Third Century Fund, plus the runaway cost of energy, the 9.3 per cent growth rate is sur- prisingly low. It has been achieved by very significant energy savings.
At first it would appear that instruction-and-research barely got its share of the total budget. However, as I pointed out in my five-year report, this is due to the lack of growth in sponsored ac- tivities during the first half of the decade. The growth rate of the Dartmouth-paid instructional and research activities has been roughly 9 per cent. Thus, instruction-and-research and the libraries and academic centers have been growing faster than the remainder of the budget. It will be noted, however, that we have had to slow down expenditures for the libraries and for other academic centers because they were beginning to use up a dis- proportionate share of our resources.
We get a truer picture of athletics from the growth-rate table. Athletic expenditures have been growing faster than the overall budget. Clearly this reflects the fact that today we have both women's and men's athletic teams. That the growth rate has not been higher with the significant increase in the number of teams has again been due to a number of economies made in the programs.
The single category in which there is a spectacular difference between the two half-decades is financial aid. As I pointed out in my five-year report, during the first half of the decade we put in place a very significant loan program, expecting all financial-aid students to meet a portion of their obligations through loans. Indeed, I commented in that report that we may have gone too far. Having more than used up this option in the first half of the decade, scholarship aid in the second half has grown more rapidly than the overall budget and more rapidly than student fees.
The two budget areas that have grown more slowly than the overall growth rate have been auxiliary activities and administra- tion. In the latter case there was a higher growth rate in the first half of the decade when the administration had to absorb the full impact of year-round operation, coeducation, and the equal opportunity program. The second half of the decade shows significant belt-tightening, and let me re-emphasize that this category was strongly affected by the growth of the Medical School, which is not shown on these charts.
Now, to the division of revenues. I cannot help being envious in looking at the previous decade and noting that four revenue categories grew at a rate higher than 14 per cent per year! Unlike the expense categories, on the revenue side there are enormous differences in the growth rate. We note the very poor perfor- mance of sponsored activity and gifts for current use in the first half of the decade. In both cases the second half has been much better, but not enough to keep pace with overall needs for the en- tire decade. Revenues in auxiliary activities have more than kept up with the expenses. The very sad news is in endowment utilized.
During the first five years, endowment revenue rose at 6.4 per cent per year. By mid-decade, it became clear that even at that modest rate we were running ahead of our resources, which were being severely hurt by a very poor stock market. Therefore, the trustees came up with a new fiscal plan, which included the launching of the Campaign for Dartmouth and a Seven-Year Plan (1975-1982) that would return us to a prudent level of en- dowment usage by the end of the campaign. To achieve this goal, the trustees mandated that endowment utilization could increase only 4 per cent a year. The net result is that each year the portion of our expenses covered out of endowment declines and in the current period of double-digit inflation, we are very badly hurt by- having endowment utilization grow by only 4 per cent per year. Indeed, the very major cuts we must make in our budget in the next two years are directly attributable to this factor.
To make up for the slippage in endowment revenue as com- pared to the overall budget, we have had both to make severe cuts and to increase other revenues more rapidly. The growth in student fees is due partly to the significant increase in the number of students and partly to ever-increasing tuition, room, and board charges. I am happy to report that in spite of these increases in charges, we are still below the average of charges for the Ivy League. The next two years are likely to see extremely high in- creases in tuition, room, and board rates, but we hope to main- tain our relative position with respect to our sister institutions. We have also pushed quite hard on direct revenues (athletic revenues, ticket sales in Hopkins Center, and charges to outside users of Kiewit). This is the revenue category that has had the largest increase.
I find it useful to look at the first three revenue categories separately as they represent the "free funds" of the College that the trustees may use as they wish.
Free Funds (Excluding Medical School) (000 omitted) 1959-60 1969-70 1979-80 Student fees $4239 (68%) $ 8775 (52%) $23428 (6096) Endowment Utilized 1599 (26%) 6075 (36%) 10150 (26*) Alumni Fund 422 ( 7%) 2117 (12%) 5250 TOTAL $6260 $16967 $38828 Percent of Gross Budget 56.3% 56.5% 59-9%
First of ail, I want to note that the Alumni Fund has increased in relative importance in both decades. As a matter of fact, its relative role had doubled over the 20-year period. The line on en- dowment utilization shows both why the sixties were the golden age and how badly we have been hit in the seventies. All the gain of the sixties has been wiped out. As we must maintain the 4 per cent growth rate for endowment utilization until the end of the campaign, the endowment will further lose its relative significance among the free funds of the College. The affluence of the sixties allowed the College to let student fees become a less important factor than they were a decade earlier. They have now returned to a position half-way between that of 1970 and that of 1960.
Overall, we note that the free funds carry a somewhat higher percentage of the gross budget than they did earlier. This is ac- tually the result of bad news that there was no growth in spon- sored activity and in gifts for current use during the first half of the decade. However, it is healthy for an institution to have as large a percentage of its expenses come out of free funds as possi- ble. At the 60-per-cent level we are much less vulnerable to fluc- tuations of outside support than are many of our sister in- stitutions.
By chance I ran across a budget for the first post-World War I year, 1918-19. Comparisons are not very easy. That budget reports auxiliary activities at net and has several categories of ex- penses that have no clear counterparts today, while there are no counterparts to many of today's activities in the earlier budget. Nevertheless, some rough comparisons are worthwhile. Instruc- tion and libraries and administration commanded roughly the same percentage of the total budget 61 years ago as they do to- day. Plant expenses were much higher then, while financial aid was very low compared with today's level. The really startling comparison came on the income side. With auxiliaries netted out, endowment carries 15 per cent of our gross expenses today. Sixty-one years ago, the endowment provided for 41 per cent of the total! I don't believe that the College will ever again return to that happy state of affairs.
In the five-year report I mentioned our then quite new com- puterized budgeting system. Under Treasurer William Davis' leadership we have continued to have superb control of our finan- cial forecasts and performance. In the past five years we exceeded our net budget once by a small fraction of 1 per cent. And the other four years we reported a modest favorable result. I doubt that any other institution has been as successful as Dartmouth in forecasting (and controlling) its budget.
It is precisely our excellent methods of forecasting that have given us early warning that we are heading into difficult years. Our forecast last fall clearly showed that given double-digit infla- tion and further rapid increases in oil prices, we were not going to make it to the post-campaign period without further significant cuts. I have recently announced that we must cut $710,000 from the base of the budget for next year and make an additional cut of 5530.000 the following year. We have used up most of our op- tions for greater efficiency, and most of the upcoming cuts will be extremely painful. Also, both the Council on Budgets and Priorities and the trustees have assigned high priority to giving larger compensation increases in a period of double-digit infla- tion. With only a 4 per cent increase in endowment utilization permitted, we cannot achieve these increases without reducing the number of people who work for the College and cutting back on programs.
We hope to achieve most of the personnel cuts through attri- tion, by not filling vacancies when they occur. We never engage in across-the-board cuts but always apply considerations of priorities, making the cuts where they will have relatively slight impact on the quality of the institution. The result will still be a reduction in the level of service we provide, and two years from now we will be missing some programs that meant a great deal to certain members of the Dartmouth community. Dartmouth will still be an institution of the very highest quality, but it is sad that in spite of all our very careful planning, totally uncontrollable ex- ternal forces have made these reductions unavoidable.
/n 1977, the Board of Trustees launched a fund drive, a five-year campaign, the most ambitious in the history of the College. There had been more than a year of advance planning to determine the needs of the College for the 1980s and to estimate the College's potential for the raising of capital funds. It required a delicate juggling act to come up with a set of targets that would meet the estimated needs and yet lie within the range that was possible even if very difficult for the College to achieve. The result was a target of $l6O million to be raised by the middle of 1982. Thanks to Addison Winship '42 and his able colleagues, as well as trustee and other volunteers, we have made excellent progress toward this goal.
The extensive planning period included lengthy discussions as to whether this would be a capital campaign in addition to the current and on-going needs of the College, whether the Alumni Fund would or would not be continued during the campaign, and how the various fund-raising activities would be integrated. The philosophy we adopted is similar to that of the highly successful Stanford fund drive, which obtained its goal of $3OO million. As Stanford is roughly twice the size of Dartmouth, the two objec- tives were comparable. We learned that one secret of Stanford's success was the launching of an all-inclusive campaign in which every gift from private sources would count toward the goal.
The advantages of such a campaign are many. We could con- tinue our rapidly growing, extremely successful Alumni Fund, which had been discontinued during one Dartmouth fund drive and intentionally held down during the, Third Century Fund. Then, many donors were disturbed by arguments as to what por- tion of their gifts did or did not count toward the campaign. This kind of conflict would be avoided by an all-inclusive drive. It would also make it easier to find suitable gift opportunities for donors of varying means. The vast majority of loyal Dartmouth alumni cannot possibly give a major gift to the College. Yet through participation in the Alumni Fund and in reunion giving, they could feel that they have made a full contribution to the success of the overall effort. There is only one major disadvan- tage of making the campaign inclusive: One must announce a much larger target figure than one would in a pure capital cam- paign. To be perfectly frank, the figure of $l6O million had a frightening ring.
An increasingly important source of funding for the College has been a variety of annual giving programs and other short- term gifts. Most important among these, of course, is the Dart- mouth Alumni Fund. Each of the professional schools also has received increasing numbers of alumni gifts and periodic gifts from corporations and foundations. In the Campaign for Dart- mouth, $4O million, a quarter of the total, was reserved for such current-use funds. This total over a five-year period would just equal the total of the sums we had been receiving each year in the recent past, with some allowance for inflationary growth. Unless we built these current funds into our campaign goals, we would have had to draw down capital funds with one hand as we were trying to build these funds up with the other.
During campaign planning, much of the discussion centered on physical facilities. In the past such facilities were a major portion of capital fund drives. Indeed, some fund drives had been designed specifically for the purpose of expanding or renovatin- the physical plant. This has particular appeal to major donors because of the attraction of being able to name a building or some distinguished portion of a building as acknowledgment of the generosity of an individual. Fortunately for the College, but unfortunately for the prospects of the campaign, physical facilities were not among the major needs of the institution. Dart- mouth is in a steady-state situation; it does not plan any signifi- cant expansion. Furthermore, the Third Century Fund built most of the urgently needed physical facilities. We also were painfully aware of the fact that any new buildings would mean additional operating costs, most important the cost of heating the buildings. For these reasons only 10 per cent of the total campaign target was earmarked for physical facilities. This is an exceptionally low number for a capital campaign, and is even more so when one realizes that this figure includes both the construction costs and sufficient endowment to underwrite the operating costs of these buildings. Of the four major projects planned, the first, the Collis College Center, is complete. The renovation of Crosby Hall and the establishment of the Blunt Alumni Center are almost com- plete. The Hood Museum and teaching facility is in the final planning stages, while the renovation of Webster Hall is still in the discussion stage pending a determination of the academic needs of the institution.
The other 65 per cent of our target, $lO4 million, was to be ear- marked for endowment funds so that endowment income would eventually be increased to something approaching its historic level in the overall support of the College. (See the discussion on the financial affairs of the College above.) Given the prudent-use formula of 5 per cent utilization of income from endowment, this would have generated slightly over $5 million dollars a year in additional endowment revenue. Unfortunately, our careful pro- jection showed that this was not sufficient for the needs of the 1980s. The combination of inflation and many poor market years had eroded the real value of the endowment to the point where a larger infusion seemed necessary. Yet, even our most optimistic estimates did not encourage us to attempt a target above $l6O million.
At this point I made a proposal to the Board of Trustees for a completely novel component of such an inclusive campaign. It occurred to me that traditional fund drives asked for two kinds of money: those that are spent immediately and those that are kept forever. The former include both current-use funds and building funds, while the latter are funds for endowment. The more 1 thought about this, the less I saw the logic in it. As it is becoming a fairly well-established pattern that colleges have to run major fund drives periodically, with roughly ten years between cam- paigns, I proposed that we might seek some funds which would be expended over a ten-year period to tide us over between cam- paigns. Such funds, invested for high yield, and with the intent of spending both the yield and capital, could assure a 15 per cent utilization for a minimum of ten years. A million dollars in such funds would for a decade or more yield three times as much as a million dollars placed into permanent endowment. It was the only means I could think of by which a given total could produce a larger yield and thus meet the needs of the College. After lengthy discussion it was agreed that the 65 per cent earmarked for long-range funds would be divided into 50 per cent, or $BO million, being placed into endowment and the other 15 per cent into special ten-year funds. Thus, the idea of the "Funds for the 80s" was born.
The novelty of this component of the campaign has attracted a good deal of attention at other institutions, and I believe that our success in this area could influence fund-raising nationally-lanl particularly hopeful that this component may appeal to those corporations and foundations that have self-imposed limitations against giving funds for endowment but might be prepared as part of a major campaign to give to a ten-year fund. Of course, there is a danger in becoming too heavily reliant on these special funds since they are used up with the decade, but there is only 524 million targeted for this area. Even at 15 per cent utilization we would be able to spend only $3.6 million per year, well below the level of annual gifts. At least these funds would be guaranteed for a decade, while one can never have such certainty about annual gifts. Also, the SBO million targeted for endowment would in- crease the total endowment by about 50 per cent.
We studied carefully other successful campaigns that ran over several years. The best conclusion we could draw was that after a period of initial giving, gifts and pledges come in roughly equal amounts in each year of the campaign. While I am not certain about the reason for this, I suspect that the pledges of those per- sons already highly committed to the institution are balanced in later years by gifts and pledges that are the results of extensive cultivation. Since our nucleus fund produced $lO million prior to the start of the campaign, we had to raise another SISO million in five years, or S3O million per year. On the opening day of the campaign I drew a small graph on which I indicated our targets. I kept this in my desk and I have been monitoring our progress every six months. On January 1 we reached the mid-point of the campaign. By my very simple formula we should by that time have raised the original SlO mil- lion, plus 575 million for a total of SB5 million. Our actual total in gifts and pledges at that point was 594 million, about 10 per cent ahead of schedule. This is very encouraging. All our ad- visers warn us, however, that campaigns tend to have a slump somewhere near the middle, when one has neither the excite- ment of the launching nor the major motivation of trying to make one's goal. Therefore, the calendar year 1980 may be crucial. If we can maintain our momentum during the current year, we should have an excellent chance of making our goal.
Having participated in the Third Century Fund (as chairman of the Foundations Committee) and having participated in fund- raising as president over the past decade, I would like to make some observations on how Dartmouth fund-raising differs from those of our best-known sister institutions. The strength of any Dartmouth campaign is the incredible loyalty of the alumni and iriends of the College who participate in great number. Dart- mouth s weakness is the lack of any large pool of potential donors who can give very large gifts. Other large campaigns tend to begin with many pledges at a million dollars and more and usually include one or two gifts at SlO million or above. Prior to the current campaign, Dartmouth had never received a single gift in excess of 52.5 million. We must make up with a large number of gifts in the SlO,OOO to 5100,000 range for the potential we lack in the million-dollar-and-above range. This requires a massive ef- fort, and that is why we have a huge number of volunteers work- ing on the Campaign for Dartmouth.
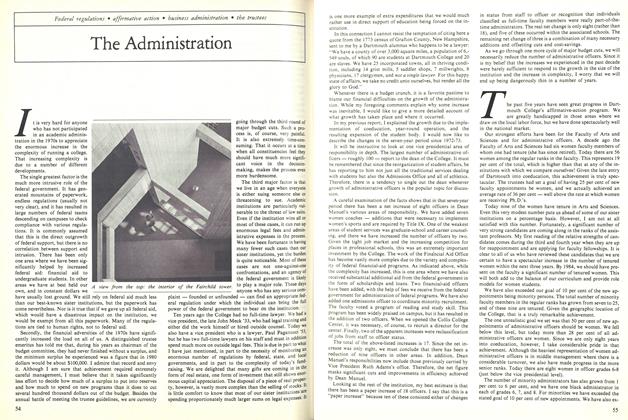
This was one more reason why integrating the Alumni Fund and reunion-giving program into the overall campaign was essen- tial for our success; without the support of such on-going machinery we could not possibly have mustered the manpower necessary. For the same reason we did not attempt to match our sister institutions in the raising of several large gifts before the launching of the campaign. Instead, for a nucleus fund we turned to individuals who had demonstrated through service their com- plete devotion to the institution. We asked the members of the Board of Trustees and the boards of overseers to make these ini- tial gifts. These 80 individuals, who were not picked because of their affluence and include many individuals of modest means, pledged a total of $lO million. I consider that kind of personal sacrifice a much more propitious launching of a campaign than a single $lO-million gift. Still, one cannot help dreaming that sometime during this campaign, from some unexpected source, a gift running into eight figures will materialize. We have already had extremely pleasant surprises in that the Collis gift ($5 million) and the Fairchild gift ($4 million) have established all-time Dart- mouth records.
There is one more important way in which this campaign differs from previous Dartmouth campaigns and from those tra- ditional at other institutions. Campaigns in the past have been launched to enable institutions to do great new things, whether it was building new structures, strengthening the faculty, or launching new academic pro- grams. The Campaign for Dart- mouth, however, is essential to assure that the financial reverses suffered by all of higher educa- tion during the 1970s will not erode the quality of this institu- tion. In the past we were able to say that if a campaign succeeded there would be tangible evidence of great new things at Dartmouth College. Now we have to say, ab- solutely frankly, that if the campaign failed we could no longer continue Dartmouth as the institution of very high quality that it is today. Many of us have worried that this negative appeal simply would not have sufficient impact, but we have been helped by the widely publicized problems of all of private higher educa- tion. Fortunately, there are enough alumni and friends of the College who think Dartmouth is so outstanding that preservation of its quality is sufficient reason for a generous gift. That we are today ahead of our ambitious schedule is eloquent testimony to this fact.
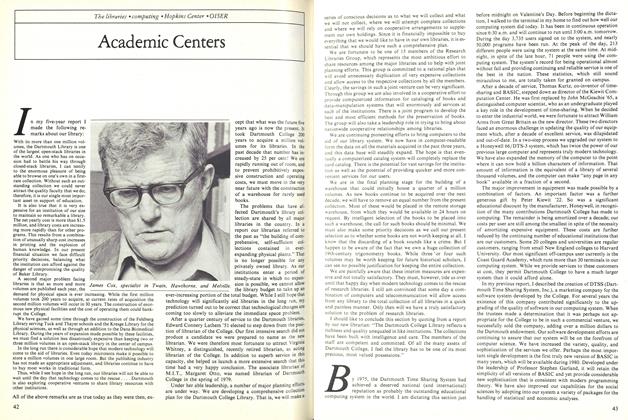
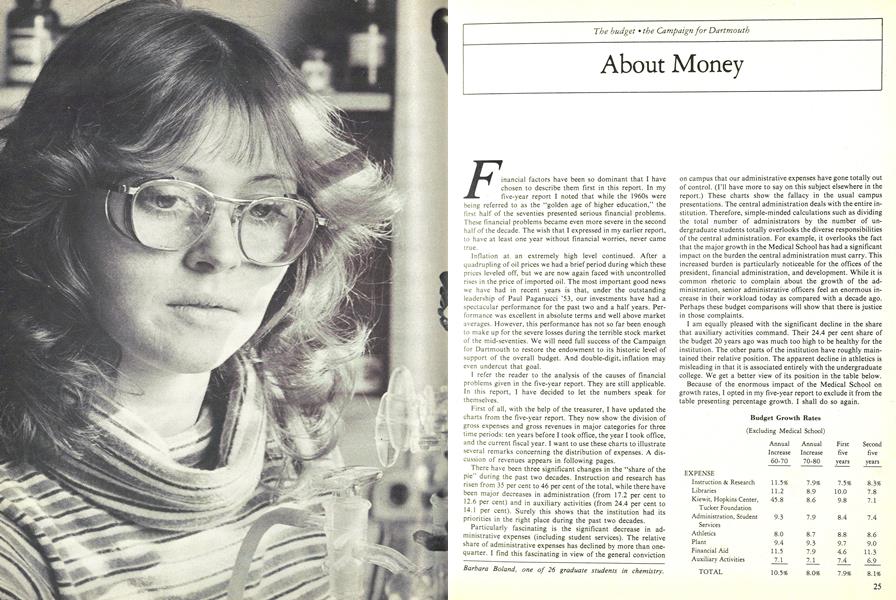
Barbara Boland, one of 26 graduate students in chemistry.
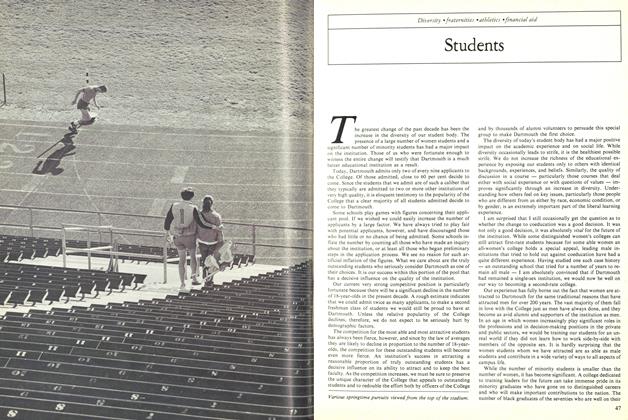
The crew: agony and even a little ecstasy for the fun of it.