The Class of 1934
FOR the first time since the selective process was inaugurated, the annual statistical report about the freshman class must be presented by a substitute rather than by Dean Bill. Mr. and Mrs. Bill are spending a year in Europe, leaving Hanover with the best wishes of the entire staff of the office, for a wellearned year's relief from responsibility.
Only one who has come to close grips with the daily routine of this office can know the variety and difficulty of the problems which present themselves. Some of the cases which come across the desk extend over several years. They involve changes in schools, changes in address, over-lapping courses and a variety of credits, many of which do not meet our requirements. In some cases, excellent students are the victims of courses of study not so planned as to meet the needs of college entrance. Such difficulties and a thousand others are met with a degree of patience and skill which it is difficult to visualize without first-hand observation.
The most distressing task is the refusal of hundreds of students, many of whom are indubitably good college material. This is always an ungracious necessity, because the parents of the refused applicants naturally feel that surpassing college prospects have been overlooked. Alumni, who have been sponsors for these applicants, likewise feel, and naturally feel, that a grievous error has been made. Frequently it must be true that such an error has been made, but the number of such mistakes seems to have been reduced to an astonishing minimum.
For these reasons, it seems to me that much of the improved scholastic standing of the college is due to the efficient and courageous administration of the selective process in the hands of Dean Bill. A happy year to him!
Dean Bill has often expressed doubts as to the validity of statistical material in connection with such matters as appear in this article. If a mathematician distrusts the validity of the material with which he works, perhaps one who is no mathematician at all may be pardoned for a still greater expression of skepticism. The following illustration may or may not show how valuable statistical material can be in inexperienced hands.
At the opening of the college year the entire freshman class submitted to a scholastic aptitude test. A small percentage of the entire class received the highest grades. The likelihood that any man whose name begins with "T" would be among the students receiving the highest grades could easily be figured out. The expectation, mathematically speaking, was 1.79 men. There were actually six men who received the highest grades and whose last names begin with "T". In other words, if statistics show anything they show that a man whose name begins with "T" has 3.35 times the normal expectation of receiving a high grade in the scholastic aptitude test. Perhaps this proves further that the selective process should be so modified that the college would give preferential treatment to those candidates whose names begin with "T".
The name most commonly to be found in the class is that of Brown. This family is represented by no fewer than 9 members, thus making it apparently a matter of consummate ease for them to keep up with the Joneses who number only 2. But they will be closely pressed by 6 Smiths, scarcely 4 of whom are named Robert.
There are two offsets to the skepticism with which one might view these statistics. One is that a composite class has been put together, composed of the students of the eight classes from 1926 to 1933, inclusive. The other offset is the fact that an experienced and able office force has compiled the figures necessary to make the statements which follow.
CLASS STATISTICS
The class of 1934 numbers 664 students and, therefore, is larger by 43 than the average class. It lacks only 9 of equalling the largest class, that of 1928, which numbered 673; and it surpasses by 112 the smallest class, that of 1926, which numbered 552. The class includes 4 transfers.
The average age is 18.01, which is not far from the average, 18.20, of the composite class from 1926 to 1933. The oldest boy is 26 years and 1 month old. The youngest, is 15 years and 9 months old. Doubtless, the improvement of the lower schools is tending to turn out better prepared students at a more youthful age, as the years go by. The tendency to accept students at more and more youthful ages is visible in many colleges. That tendency is, in general, deprecated by this office. Dean Bill feels, and I thoroughly agree with him, that a student of 18 years, other things being equal, is better fitted for the general possibilities of college life than most students of 15, 16, or 17. Hence this office has continually advised parents against sending boys to college at 15 and 16. Moreover, so many students apply for entrance to a freshman class at Dartmouth that we are continually faced with the necessity of choosing between two applicants who appear to be equal in all respects except in regard to age. In such cases, if one applicant is older and the other younger than 18, the older one is sometimes admitted on the ground that it is high time for him to be getting into college; and the younger one is urged to take a further year of maturing at a preparatory school. If there were room for both these students and they were equally prepared, both would doubtless be taken; but where a choice must be made, it seems more nearly fair to take the student who, because of age, would be most benefited by coming immediately into college.
GEOGRAPHIC DISTRIBUTION
The table herewith, showing geographic distribution, presents in the left column the average number of students from a given state in the hypothetical composite class. The right column shows the number of students from that state in the class of 1934.
Some of the changes presented in these columns are worthy of especial notice. Connecticut, with a 34% increase over the average Connecticut delegation, is the largest group from that state in the composite class. The Illinois group, showing a 28% increase is similarly the largest Illinois delegation. With almost double the average number, it is clear that more of our students come from Missouri than ever before. The New Jersey group is also a record group and seems likely to increase in the immediate future. New York, with 153, presents the largest New York delegation which the college has ever had. The 34% increase over the average of the composite class is due, doubtless, to the influence of New York city and its environs.
On the other hand, the New Hampshire delegation is small and growing smaller, and the Vermont delegation is similarly shrinking.
It is a pleasure to turn from figures which are changing so decidedly that one who reads them is fearful that some important trend is hidden away in them, and to note the record presented by Massachusetts. That state year after year sends a large and dependable delegation to the college,—a total of 1172 in the classes from 1926 to 1933. This number does not include, of course, the great number of students whose homes are in other parts of the country, but who are educated for college in Massachusetts schools. In addition to being a delegation whose size is a great asset to the college, the quality of this group is as good as anything that the college receives. In short, as the eminent Daniel Webster once said, "I shall enter on no encomium upon Massachusetts—she needs none."
GEOGRAPHIC DISTRIBUTION
States 1926-1933 1934 Alabama 0.3 0.0 Arizona 0.4 0.0 Arkansas 0.4 0.0 California 5.7 6.0 Colorado 5.3 3.0 Connecticut 31.3 42.0 Delaware 2.0 2.0 District of Columbia 7.3 3.0 Florida 2.6 0.0 Georgia 0.4 2.0 Idaho 0.4 2.0 Illinois 43.8 56.0 Indiana 5.5 8.0 lowa 5.9 3.0 Kansas 1.4 1.0 Kentucky 1.5 3.0 Louisiana 0.1 1.0 Maine 8.9 6.0 Maryland 2.7 3.0 Massachusetts 146.5 143.0 Michigan 10.7 13.0 Minnesota 9.7 6.0 Mississippi 0.0 0.0 Missouri 5.3 10.0 Montana 2.5 1.0 Nebraska 5.0 5.0 Nevada 0.3 0.0 New Hampshire 43.0 28.0 New Jersey 43.7 53.0 New Mexico 0.1 0.0 New York 114.3 153.0 North Carolina 0.4 0.0 North Dakota 0.8 0.0 Ohio 33.4 38.0 Oklahoma 3.2 1.0 Oregon 1.1 2.0 Pennsylvania 31.4 27.0 Rhode Island 4.9 8.0 South Carolina 0.3 0.0 South Dakota 0.6 0.0 Tennessee 2.4 3.0 Texas 2.6 1.0 Utah 0.8 0.0 Vermont 14.0 9.0 Virginia 0.9 4.0 Washington 2.1 0.0 West Virginia 3.3 2.0 Wisconsin 5.5 8.0 Wyoming 0.4 2.0 Foreign 5.9 6.0 Total 621.0 664.0
SECTIONAL GEOGRAPHIC DISTRIBUTION
1926-1983 1934New England 248.6 236Middle Atlantic 194.1 238Southern 25.7 22Central 127.6 148Rocky Mountain 10.2 6Pacific 8.9 8Foreign 5.9 6Total 621.0 664
The comparison between the composite class and the class of 1934 in regard to its sectional geographic distribution also shows one or two interesting changes. New England shows a slight shrinkage, but only a slight one. Last year Dean Bill hazarded a guess that the New England delegation was oscillating around a 38% figure. This year it is actually 35.5% of the entire class.
The Middle Atlantic group has greatly increased and now duplicates almost exactly the number from New England. The recent increase from this section is due largely to the increase from New York city and its vicinity.
The Central States group is also increasing in size and is, this year, the largest since the selective process began. Possibly the growth and size of this delegation is a reflection of the activity of the Illinois alumni.
FAVORED GROUPS
1926-1933 1934 Alumni 35.8 55 New Hampshire 43.0 28 West of Mississippi 54.0 41 South of Ohio and Potomac 19.5 20 Foreign 5.9 6 Total 158.2 150
The average number of men in a composite class falling within the so-called "favored group" is 158.2. The favored group in the class of 1934 numbers 150 men. It cannot be too often emphasized that this group is not favored in the sense that men are admitted who are lacking in credits. As Dean Bill said in his article of last year, the group which is supposed to receive preferential care under the selective process must be "properly qualified" in order to receive such consideration. The shrinkage in the size of this delegation is due to the fact that fewer men in the class are from New Hampshire and from west of the Mississippi. The shrinkage from these sections is not quite made up by the increase in the number of alumni sons. The remedy for this discrepancy would seem to be reasonably obvious.
Any study of the occupations of the fathers of new comers to the college body is surrounded with dangers. In many cases, the student is highly indefinite in regard to the special function which his father performs.
It is evident, nevertheless, that business men and lawyers account for 65% of the entering class. It is clear also that representatives of some occupational groups are distinctly diminishing, and seem likely even to disappear from the college enrollment. This is a remarkable but apparently an unavoidable reflection of some obvious changes in American society outside the college.
OCCUPATIONS OF FATHERS
1926-1933 1934 Business 368.6 391 Lawyer 38.4 43 Physician 35.2 37 Artisan 29.4 27 Engineer 28.5 34 Educator 21.9 27 Farmer 15.1 4 Clerk 15.4 7 Civil Service Official 10.6 3 Artist or Author 10.5 4 Dentist 7.3 5 Editor 6.2 4 Accountant 6.6 7 Clergyman 6.0 4 Chemist 3.9 5 Miscellaneous 17.4 62 Total 621.0 664 Deceased 45.6 36
It will be of interest to alumni who fear that the college of today is appealing only to sons of the fortunate and wealthy to know how many widely different social groups are to be found in the freshman class. One letter which crosses the desk is from a nationally known business executive and is typed immaculately on heavily embossed paper. The next is written by a high school teacher, a graduate of the college, who is interpreting for parents who are unable to read or write English with sufficient accuracy, but who are proud to give their son an opportunity which they themselves could never have. Fortunate the College that can have both families among its friends!
BUSINESS
1926-1933 1934 Business Executive 131.9 80 Merchant 59.3 39 Manufacturer 46.0 29 Realtor 20.0 21 Salesman 20.5 12 Insurance 18.4 25 Contractor and Builder 17.4 12 Banker 19.0 19 Broker 15.3 11 Hotel and Restaurant 5.6 2 Printer 5.2 8 Druggist 4.1 0 Advertising 5.9 9 Unclassified 124 Total 368.6 391
Any attempt to determine the types of business in which the fathers of freshman are engaged is a doubtful one. It is to be feared that the above statistics are about as reliable as the figures about men whose names begin with "T." Not only is it true that boys do not always know what particular branch of business their fathers are in; but even if they were well-informed, it would be difficult, indeed, to agree on classifications. For example, is anybody engaged in "advertising" able to qualify as a "business executive?" What is the answer if a father handles real estate and also sells insurance? And so on indefinitely. The members of the class of 1934 have with characteristic directness cut straight through this difficulty. They have recorded their fathers in 124 cases as "unclassified." The reader may regard this number as covering a multitude of sins, or as a convenient label for a large number of odds and ends.
VOCATIONS
Planned Considered TotalBusiness 134 92 226Lawyer 51 65 116Physician 50 33 83Artisan 0 0 0Engineer 30 44 74Educator 17 21 38Farmer 0 0 0Clerk 0 0 0Artist or Author 33 6Civil Service Official 0 0 0Dentist 0 33Editor 12 20 32Accountant 0 2 2Clergyman 0 33Scientist 8 7 15Miscellaneous 8 23 31Total 313 316 629None planned or considered 35Total 664
For the last two years, entering students have been asked to note any vocation which they have definitely planned to take up; and also to indicate any vocation which they have considered, but not in any way decided upon. All answers to such questions are, of course, the substance of things hoped for, and not much evidence of things unseen. They are in the nature of a preliminary estimate of the future.
It is interesting to see the number of parents who are highly concerned because their sons do not, at the opening of freshman year, know what types of business and professional life they expect to enter. This is a condition, nevertheless, which should not cause any undue degree of concern. It is the commonest of human experience to be unable to see far ahead in regard to the development of one's professional or business career. Probably few men now actively engaged in earning a livelihood are doing precisely what they dreamed of doing twenty or thirty or forty years ago. In the case of physicians this statement is less likely to be true. In most cases, however, it is experience that men, as they go on in life, develop unexpected capacities or are met with unexpected and perhaps adventitious opportunities. These changes divert the lawyer into a business man; the teacher into an advertising manager; the works-manager into a professor; and all sorts of people into insurance salesmen. The function of the liberal college is to give the undergraduate a general intellectual development. This development should be broad enough and deep enough to provide a substantial foundation for whatever career may be in store for him. This does not mean, of course, that the undergraduate who feels himself ordained for a certain type of business or profession should refuse to go into that line of activity. Nor does it mean that the undergraduate should give no thought to his future. But it does mean that the student who does not know at the beginning of his college course, or even in his senior year, precisely what he wishes to do in life, is in no extraordinary situation. He is simply passing through a period of development, of indecision, and of finding himself, which is commonly experienced by a very great many people.
The number of men planning or considering the law as a profession is so great as to be a cause for considerable thought. One hundred and sixteen members of the class of 1934 have planned to enter the law, or have considered such plans. This number is not due solely to the influence of the fathers, for only 43 fathers are so engaged. It is becoming increasingly evident that Dartmouth students are looking toward the legal profession in very large numbers. If I recall correctly, a very recent class was represented in the Harvard Law School by no fewer than 53 members. This number, together with members of that class in other law schools, and including men who considered law, but did not go to law school, is a very large fraction of that class, as it is of other recent classes. It is perfectly clear, therefore, that some sort of vocational guidance will shortly be necessary for Dartmouth students who are considering the profession of the law. After talking with many undergraduates with legal ambitions I am convinced that a very small fraction of them really know what "going into the law" means.
REASONS FOR CHOOSING DARTMOUTH
1. Reasons rather definitely connected with the intellectual reputation of the college: Scholastic Standing 90 General Reputation 88 Its Graduate Schools 60 Its Curriculum 51 Standards 15 304 2. Reasons more definitely personal: Impressions by Alumni and Undergraduates.... 105 Dartmouth Ancestry 30 Friend's Advice 14 Father's Wish 10 Principal's Recommendation 2 161 3. Miscellaneous reasons: Location and Environment 97 Composition of Student Body 20 Its Size 17 Outdoor Life 16 The College Spirit 11 Traditions 10 Non-coeducational 9 Eastern College 9 Winter Sports 4 Democratic 4 Scholarship Aid 3 Athletic Reputation 1 201
He who runs may read in these statements of reasons for entering Dartmouth that the intellectual life of the college is the great attracting force for men coming here at the present time.
The exhibit of reasons for choosing Dartmouth, however, does not tell the whole story. One student came hither because he had seen "a sample alumnus"; another because "I have heard that it is not only an institution of learning, but also a place without 'showoffs' and 'sticklers for style.' " Another finds the reason in "an almost total lack of hay fever." Still another declares, and I suppose we must believe him, that he was "influenced by alumnae of my acquaintance." And finally one boy leaves us in some doubt as to our status by saying that "Dartmouth has been recommended to me as the best preparatory school in the country." One who does not choose to run with the ordinary interpretation of "preparatory school" may understand this boy to mean that Dartmouth is the institution which most thoroughly prepares for a useful and happy life.
Perhaps it should be said that in compiling the above table of statistics we have taken the liberty of omitting the student who wrote for information to "Dart Mouth College, Handover, N. H."
CHURCH PREFERENCES
1936-1933 1934 Congregational 137.1 111.0 Episcopal 106.8 122.0 Presbyterian 89.8 77.0 Roman Catholic 66.0 69.0 Methodist 53.7 36.0 Baptist 33.1 30.0 Jewish 29.2 53.0 Christian Scientist 20.9 15.0 Unitarian 20.2 14.0 Lutheran 10.2 10.0 Universalist 6.8 3.0 Christian 4.4 2.0 Miscellaneous 14.5 11.0 No Preference 28.3 111.0 Total 621.0 664.0
The lessened interest in the more common Protestant churches, which has been noticed in previous years, continues to be the dominant note in connection with church preferences. The most prominent increases are to be seen in the number of men who prefer the Episcopal and Jewish churches, the latter replacing the Methodist Church as fifth in the list of adherents. These increases, likewise, were noticeable last year and seem to indicate for the present, at least, a continuing tendency. Perhaps it should be said, whether rightly or wrongly, that one man was included in the former of these two groups who declared that his preference was for the "Episcopole Church."
Possibly the number of men who declare that they have no preference, will be the item in this column which will most challenge attention. At first sight it seems as if the men who, a generation ago, had a distinct preference for the older type of New England Protestant church, were now casting over all religious affiliations. This may, or may not be the actual fact. Perhaps it will throw some light on the matter if we compare the situation of the students with the probable attitude of their parents. It may be assumed, let us say, that the average parents are twenty-five or thirty years older than their son. On this assumption, how would the religious preferences of the parents today compare with their own preferences of twenty-five or thirty years ago? Undoubtedly a very great number of parents would be obliged to record at the present time "no preference," where twenty-five or thirty years ago, they would have been scandalized at any one who was so irreligious. Perhaps it is fortunate that these statistics cannot be gathered.
COLLEGE TRAINING OF PARENTS
1926-1933 1934 Sons of Dartmouth Alumni 35.8 55 College-Trained Fathers 168.0 233 Number of Colleges—Fathers 78.0 73 College-Trained Mothers 63.3 91 Number of Colleges—Mothers 38.9 41 Both Parents College Bred 39.8 57
These figures are of more than usual interest, for it is apparent that the increase of alumni sons over the composite average is nearly 54%. The class most completely represented among them is the class of 1905 with 7 members. Of equal interest is the increase in the number of college-trained fathers, which amounts to 39%; and an increase in the number of college-trained mothers, which totals nearly 44%. A mathematician, I presume, would find some highly important trend in the fact that the increase in the number of college-trained mothers is greater than the increase in the number of collegetrained fathers. Possibly this increase is due to the prohibition amendment, or to the effect of the World War, or even to the fact that more girls are going to college these days than ever went before.
The colleges whose alumni are best represented in the class of 1934, aside from Dartmouth, are Harvard and the University of Michigan, represented by 14; the Massachusetts Institute of Technology with 9; and Columbia with 8. The colleges of the mothers are Smith 10, Vassar 9, Wellesley 7, Hunter 5.
SCHOOL REPRESENTATION
No. of No. from No. from No. fromSchools Public Private Public Private Colleges1926-1933 334 242 92 391 226 41934 332 228 104 381 279 4
As has always been the case, Dartmouth still continues to receive students from a large number of different schools. In fact, in the case of the class of 1934, exactly half as many schools are represented as there are students in the class.
The number of students coming from private schools shows, as last year, a slight increase. I have no doubt, however, but what this increase means on the whole precisely what Dean Bill said in his article of last year. For fear that a few alumni may not recall with exactness the sentence referred to, I quote from the ALUMNI MAGAZINE of November, 1929: "This fact unquestionably means simply that more and more parents are giving their sons at least one additional year away from home in private school before entering college." Mr. Bill then adds without comment the statement: "Such boys are credited in the above statistics to the last school attended." Such a practise may be necessary, but it seems misleading. If a boy spends four years in a public high school and one year in a private preparatory school, our statistics indicate that he comes from a private preparatory school. For example, 75 of the members of the class of 1934, who are indicated as coming from private preparatory schools, spent four years in public high schools and only one year in private schools. Another case, an exaggerated one to be sure, but a case which shows how misleading these statistics may be, is that of a freshman who spent ten years in a public school system and two years in a private school, but was credited on our books as coming from a private school. It may be true, of course, that the two years in the private school gave him more intellectual headway than the ten years in the public school. But in the nature of things, this is unlikely. Only a detailed study of the individual cases could determine whether the one training or the other stimulated and prepared a particular boy for a college career.
NUMBER OF STUDENTS FROM A SCHOOL
1 2 3 4 5 6 7 8,9,10 Maximum 1926-1933 211.0 67.1 23.6 11.5 7.4 4.0 2.3 6.1 21.4 1934 210.0 60.0 24.0 12.0 9.0 4.0 5.0 6.0 $2.0 From this table it appears that the number of schools sending a single student to college is so great, namely 210, as to provide a very broad and substantial foundation in the clientele of the college. The largest delegations from private schools are always of interest and are as follows:
School Representation—Private
Phillips Exeter 32 Tabor 18 Deerfield 17 Horace Mann 13 Worcester 9 Andover 8 Mercersburg 8
The public schools apparently believe in the magic efficacy of the number 7, for 5 of these are tied for the honor of sending the largest delegation, each of them with 7 students. These lucky schools are the following:
School Representation—Public
Columbia Grammar School, New York city 7 Evanston, 111., Township High School 7 Lawrence, Mass., High School 7 New Trier Township High School, Winnetka, 111.. . 7 Oak Park, 111., and River Forest Township High School 7 METHODS OF ADMISSION
1926-1933 1934 Certificate 504.9 535 Examination 43.0 63 Certificate and Examination 69.1 62 Transfer 4.0 4 "Honor" Certificate 236 .0 375
Perhaps nothing connected with the statistical study of the entering class is of more importance and interest than a study of the methods by which the students entered.
The number of men entering by Honor Certificate is nearly 57% of the class. In other words, almost threefifths of the members of the class of 1934 stood in the first quarter of their respective preparatory school classes during at least the last two years of their preparation. It requires no argument to emphasize the fact that the class-room work of the college is infinitely benefited by the obviously thorough preparation which the members of the class have received. Nor, under these circumstances, is it hard to explain the continuing shrinkage in the number of freshmen separated from college at the end of the first semester during the last six or eight years.
In this connection, it may be of interest to alumni to know that among the members of the class of 1934 are no fewer than 31 preparatory school valedictorians. These range all the way from the first student in relatively small high schools, to men who stood at the top in classes of two hundred, three hundred and four hundred. (This last fact reminds me somehow of the large number of alumni who have said during the last few years, "It is just as well that I took my college course when I did.")
INTERESTING INCIDENTS
Far more interesting, even if less important, than any tables of statistics are the dramatic and the humorous incidents which individual cases present. Such are the following,—none of them representing individuals, but composites of several or many cases.
Among the different types of applicants whom I feel like attempting to make over, is the boy who is entirely "carried" by his parents. This boy's parents ask all the questions, answer the letters, fill in the forms, visit the office and make all the objections. The result is that we have a good picture of the father and mother but know almost nothing of the boy. In some of these cases I have felt that we ought almost to admit the father or mother and send the boy out into the world to earn his living.
There is the case, too, of the many boys who appear in Hanover with almost no financial resources whatever. A few of these arrived in the office just prior to the opening of college, having a scholarship and a small amount of borrowed money, which was insufficient to pay even the initial bills. As the college had already granted these students scholarship aid, it was impossible to do anything further for them at that time. In response, therefore, to the question as to what they could do, the only possible reply was, "You should comb the town for work sufficient to take care of your board and room." Within forty-eight hours the boys were back in the office to say in so many words, "I am all set. I have a job." At the present time when all expenses are so large, it is not advisable for any student to come to college without seeing his way farther ahead than these boys had done. Nevertheless, we do pay our tribute of admiration to a boy who is willing and able to take such a chance and to take it successfully.
Perhaps the following composite story may arouse in the minds of some alumni entertaining recollections of the past. Here are two boys who appeared in the office one morning together. They both had every evidence of being perfectly new to the college, even if freshman hats sticking out of their pockets had not been further advertisement, but they remarked in order to make sure that their identification was complete, "We are Freshmen." They were.
On inquiry I found that they had been talking with the Bursar, Mr. Max A. Norton, for they declared that they had just paid their bills at the "Bazaar's Office." They then said that they had asked the "Bazaar"— or possibly their expression was "Bizarre"—how much rebate they would get on their room rent in case they behaved themselves during the year. On Mr. Norton's surprised objection that rebates were not in order, the spokesman replied, "Oh, yes, we know that rebates are given because two boys upstairs in our dormitory told us so." Evidently Mr. Norton was not sufficiently convincing, for they went on to explain that they were positive rebates were granted "because the two boys upstairs received such a rebate last year." Mr. Norton then urged the two to take care not to purchase any radiators, and sent them away wiser men. It seems apparent that it will not be necessary to have a long roll of watchmen to take care that the old traditions do not fall into innocuous desuetude.
One attitude taken by many members of the class of 1934 who come into this office is so frequently expressed that I feel sure of alumni interest in it. I cannot imagine any class being more completely thrilled with their early days in college than this class. They have expressed their great appreciation of the sympathetic approach of the men whom they have in the class room and of their fellow students in the dormitories; as well as their delight in the Outing Club trips and cabins. As one boy said, "You feel as though New Hampshire was a huge giant who had grasped your heart and soul and would not release it. You really cannot appreciate the beauties of the college and the country until you become a part of it." Perhaps it will be apparent from these few cases, which are a few out of many, that in the best sense of the words, the college is already putting the Indian sign on the class of 1934.
There is also the type represented by John Doe, a name which, again, embodies no single case. Some years ago John Doe met with a serious automobile accident which not only crippled him, but left him a prey to several serious attacks of illness. For several years it was necessary for this boy to pass through untold miseries in operations, in sojourns in hospitals, and in various types of reconstructive exercises. While the years were passing on, John Doe's friends and schoolmates were either through college, or looking forward to graduation in a relatively short time. It now became necessary, if John was ever going further with his education, to accumulate the necessary credits for college entrance within a single year. To this task he set himself with the same unconquerable courage that had characterized his fight for physical recuperation. His year seemed to be successful. In June he took an appalling number of College Board examinations. In mingled fear and hope he awaited the results, for this was a crucial time in his life. When the returns came in, it was discovered that he had gained a victoryalmost. He had failed in a single unit. But John Doe was of the stuff that men are made of. He asked for and received permission to go to tutoring school during the summer and take an examination in the single unit. The permission was granted. The examination was taken. And on a day early in the college year I sat at the desk in this office with John Doe opposite me and had spread out before me his entire early record. At that moment the result of his final examination was placed on the desk. He had not only passed, but had passed by a wide margin. At last the final triumph. I wish that every alumnus of the college could have seen and felt the situation, as I looked over the record to see that every unit was correct and authenticated, and then said, "Doe, you are in!" And I wish that every alumnus could have seen the tears of victory that welled to John Doe's eyes as he said, "That gives me a life!" The college did not really owe me any salary that day.
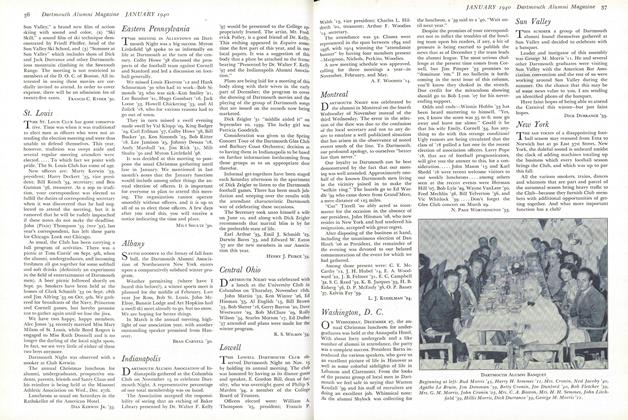
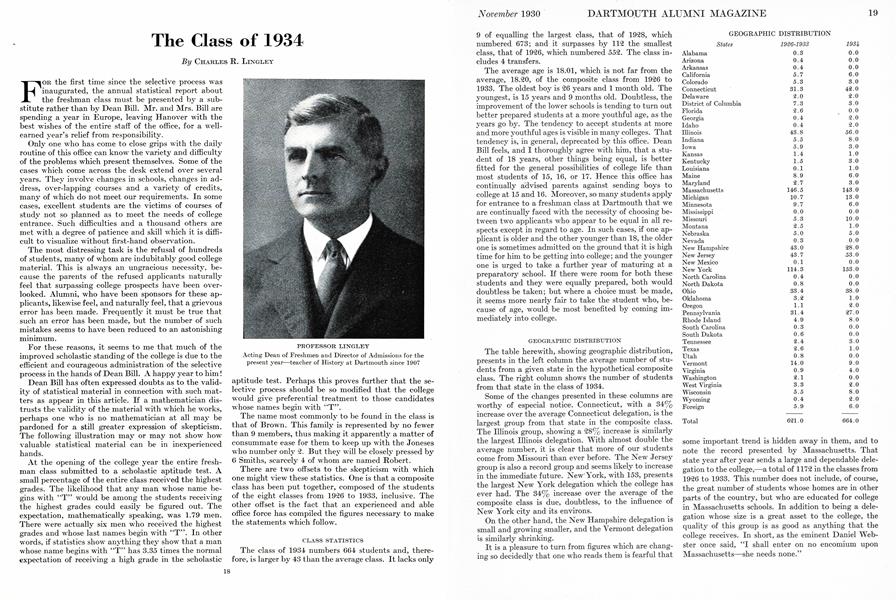
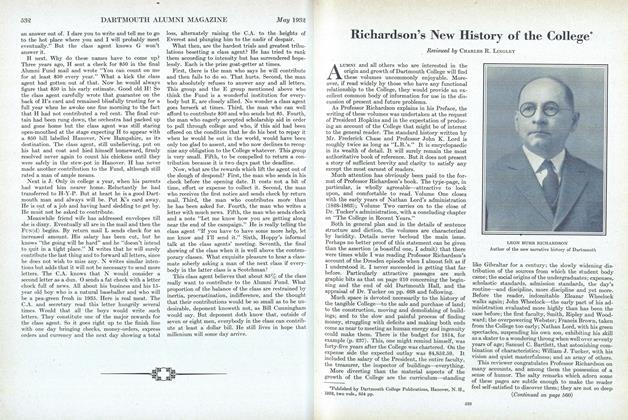
PROFESSOR LINGLEY Acting Dean of Freshmen and Director of Admissions for the present year—teacher of History at Dartmouth since 1907
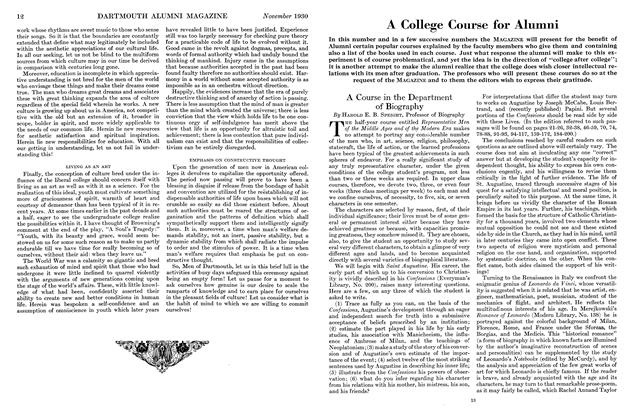
Charles R. Lingley
-
 Books
BooksThe Life of Thomas Brackett Reed
-
 Article
SALMON P. CHASE, UNDERGRADUATE AND PEDAGOGUE
October 1919 -
 Books
BooksMemories of Many Men in Many Lands
June, 1923 -
 Books
BooksWILLIAM HOWARD TAFT
January, 1931 -
 Article
Some Misapprehensions in Regard to the Selective Process
February, 1931 -
 Article
Richardson's New History of the College*
MAY 1932