The Quality of Life: YOUR MOVE
You have just been promised ajob by the Allstate Money Company.You have your choice of location inany one of the continental 48 states,USA. Irrespective of where youlive, your income and costs for theyear will be exactly the same.Tho' 'round the girdled earth they roam.Her spell on them remains;They have the still North in their hearts,The hill-winds in their veins,And the granite of New HampshireIn their muscles and their brains.
Little did Richard Hovey '85 realize how appropriate his words would be for men of Dartmouth almost 90 years after his graduation.
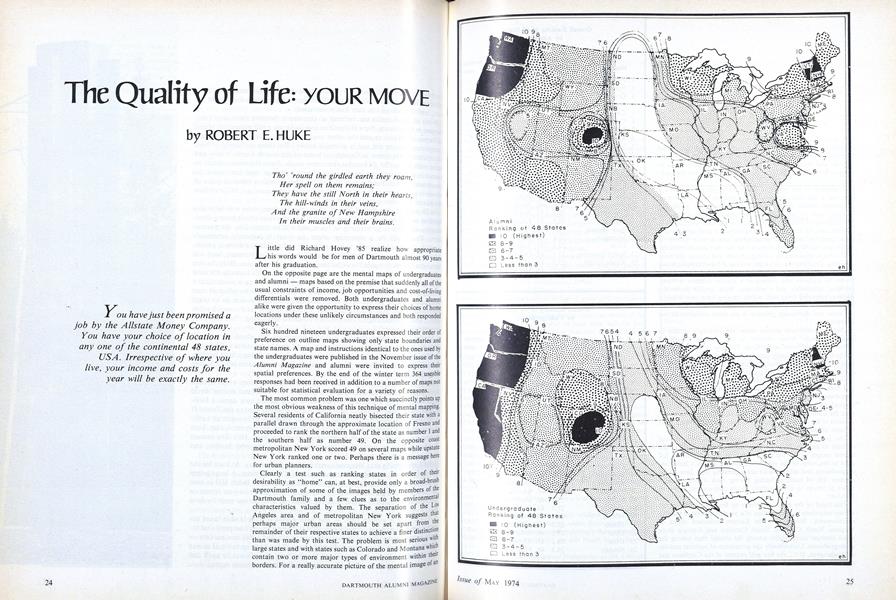
On the opposite page are the mental maps of undergraduates and alumni - maps based on the premise that suddenly all of the usual constraints of income, job opportunities and cost-of-living differentials were removed. Both undergraduates and alumni alike were given the opportunity to express their choices of home locations under these unlikely circumstances and both responded eagerly.
Six hundred nineteen undergraduates expressed their order of preference on outline maps showing only state boundaries and state names. A map and instructions identical to the ones used by the undergraduates were published in the November issue of the Alumni Magazine and alumni were invited to express their spatial preferences. By the end of the winter term 364 useable responses had been received in addition to a number of maps not suitable for statistical evaluation for a variety of reasons.
The most common problem was one which succinctly points up the most obvious weakness of this technique of mental mapping Several residents of California neatly bisected their state with a parallel drawn through the approximate location of Fresno and proceeded to rank the northern half of the state as number 1 and the southern half as number 49. On the opposite coast metropolitan New York scored 49 on several maps while upstate New York ranked one or two. Perhaps there is a message here for urban planners.
Clearly a test such as ranking states in order of their desirability as "home" can, at best, provide only a broad-brush approximation of some of the images held by members of the Dartmouth family and a few clues as to the environmental characteristics valued by them. The separation of the Los Angeles area and of metropolitan New York suggests that perhaps major urban areas should be set apart from the remainder of their respective states to achieve a finer distinction than was made by this test. The problem is most serious with large states and with states such as Colorado and Montana which contain two or more major types of environment within their borders. For a really accurate picture of the mental image of an area as large as the United States, the available divisions should number not 48 but several hundred. Such a test, however, would presuppose more knowledge of the country than generally prevails and would be so complex and time-consuming as to severely limit the number of persons willing to attempt the ranking.
Differences in the perceived character of places have always been one of the chief interests of the geographer because it is these differences which generate flows of people, of goods, of services, and of ideas. Such movements account for the depopulating of rural North Dakota, for the land speculation in Florida, and for the flight to the suburbs. To analyze these and other complex problems, geographers use a wide variety of techniques including mental maps like the ones shown opposite.
The maps produced by undergraduates and alumni are most revealing. Omitting the very high ranking of New Hampshire and Vermont, these maps show spatial preferences similar to those shown by students who completed a similar exercise in Penn-sylvania, Minnesota and California. With similar preference patterns emerging from such widely ranging locations, it might be safe to assume a strong pressure for growth in the high ranking areas and decreasing pressure in the areas perceived as less desirable.
Undergraduate and alumni maps are strikingly similar in several respects. Most obvious is the marked trough of abhorrence for a home on the Great Plains or in major portions of the Old South. Equally clear is the strong preference to live near a large body of water in either the northeastern or the northwestern portions of the country.
On both maps the lure of Leadville and Durango (or is it Aspen and Steamboat Springs?) creates a marked peak in Colorado. This Colorado crest declines only slowly to the north on the undergraduate map to include Wyoming as a high plateau. By contrast the Colorado peak on the alumni map is partially shared by Arizona to the southwest. Perhaps a desire of older bodies for the warmth of the famed desert sun?
The patterns in the northeast quadrant are complex and difficult to explain. One common and important aspect of the mental images is that the focus of desirability is centered a full state to the north of the population concentrations. Clearly undergraduates and alumni alike are expressing their love of the outdoor life, of hunting, fishing, hiking, rock climbing, and a desire to return to climes similar to the pine-scented woods of Hanover.
This trend to the north is obvious on both maps, but on the alumni map there is an indication of a parallel interest in warmer environments. Notice how the Eastern Seaboard states of Virginia, North Carolina, South Carolina and Georgia show much stronger acceptability among the alumni than among the undergraduates. Undoubtedly the attractions of political activity in Washington, D.C., the fine golf courses of the Carolinas and the dynamic life in and around Atlanta have a stronger appeal to the the more mature alumni. Florida, by contrast, stands well above the Old South on both maps and is attractive to young and old alike. Interestingly, the drop between Florida and adjacent Georgia is highly significant even on the alumni map.
On both maps West Virginia and New Jersey stand out as anomalous within their respective regions. West Virginia creates a sinkhole in the surface with a mean score significantly lower than that of any neighboring state. This might well be a result of poor publicity in recent years concerning pit and strip mining as weil as highly publicized unemployment and poverty. In the case of New Jersey a single traffic-jammed, unsightly and malodorous trip along the Jersey Turnpike is suspected of being memorable enough to overcome all of that state's obvious advantages of variety and proximity to population centers.
On both maps the most dramatic contrast offered by adjoining states is that of Colorado in the top decile and its eastern neighbor Kansas in the bottom decile on the alumni map and next to the bottom on the undergraduate map.
Each map is divided into eleven preference levels. From the highest surfaces or peaks toward the lowest areas each preference level, set off by a numbered contour, represents a decile and includes either four or five states depending upon the spread in the average ranking. The lowest decile in each case includes two states whose ranking is markedly lower than that of the next state up the ladder. On each map these two states are set off by the contour marked 1. In each case the state perceived as the worst place to live is Mississippi.
The table of home state ranking by residents of those states is also interesting. Northern New England, Colorado and California are found to be fine places to live and residents are content with their present environment, although the appeal of California takes on a modest tarnish with increasing age of the viewer. Of the ten alumni residents of Maine who sent in their ratings, nine picked the Pine Tree State as number one and a single respondent said he would prefer to live in New Hampshire but Maine was second best. This average ranking of 1.1 was the highest by far for either group for any state.
Home state rankings indicate that age markedly increases the attractiveness of Florida and slightly improves the perception of both Pennsylvania and Connecticut. By contrast alumni residents of New York, Rhode Island, Massachusetts, Ohio, and Virginia find these states less attractive than do their younger counteracts. Age apparently has little impact on the evaluation of Illinois and New Jersey. Little allegiance is shown to these states by residents of any age.
The importance of "place" is clearly evident in the mental maps of undergraduates and alumni alike. Four years on the Hanover plain have influenced us more strongly than we perhaps realized and have truly implanted the still North in our hearts.
Overall Ranking of 48 Statesby AlumniAverage AverageState rank State rank 1. New Hampshire 7.9 25. Maryland 25.7 2. Vermont 8.6 26. Illinois 27.2 3. Oregon 9.5 27. Kentucky 27.3 4. Washington 10.7 28. Ohio 27.5 5. Colorado 11.9 29. Nevada 27.7 6. California 12.6 30. Tennessee 28.5 7. Maine 12.6 31. Delaware 28.5 8. Massachusetts 15.3 32. South Carolina 29.0 9. Virginia 17.5 33. Georgia 29.7 10. New York 17.8 34. Indiana 29.8 11. Wisconsin 17.9 35. Texas 30.0 12. Connecticut 18.4 36. West Virginia 30.5 13. Minnesota 18.6 37. New Jersey 30.6 14. Arizona 18.8 38. Missouri 32.1 15. Idaho 19.2 39. Iowa 32.1 16. Pennsylvania 19.4 40. South Dakota 33.0 17. Wyoming 19.5 41. North Dakota 33.8 18. Montana 20.9 42. Louisiana 35.2 19. New Mexico 21.1 43. Nebraska 35.2 20. Michigan 21.4 44. Kansas 35.8 21. Utah 22.1 45. Arkansas 36.4 22. North Carolina 22.1 46. Oklahoma 37.1 23. Rhode Island 23.2 47. Alabama 39.5 24. Florida 25.2 48. Mississippi 41.5
Overall Ranking of 48 Statesby UndergraduatesAverage AverageState rank State rank 1. California 8.4 25. New Mexico 24.3 2. Oregon 10.4 26. Rhode Island 24.9 3. New Hampshire 10.8 27. Maryland 25.2 4. Washington 11.5 28. Texas 25.8 5. Colorado 11.9 29. Kentucky 26.2 6. Vermont 12.5 30. Indiana 26.4 7. Massachusetts 14.4 31. North Carolina 26.4 8. Maine 15.3 32. Delaware 28.3 9. New York 15.5 33. Missouri 29.3 10. Wisconsin 18.4 34. Tennessee 29.3 11. Pennsylvania 18.6 35. North Dakota 29.8 12. Michigan 19.2 36. New, Jersey 30.0 13. Wyoming 19.2 37. South Dakota 30.6 14. Connecticut 19.5 38. Iowa 30.7 15. Montana 19.8 39. West Virginia 32.1 16. Minnesota 19.9 40. Nebraska 32.4 17. Virginia 20.4 41. Kansas 33.0 18. Idaho 21.1 42. South Carolina 33.6 19. Arizona 21.5 43. Oklahoma 33.6 20. Florida 21.9 44. Georgia 35.4 21. Illinois 22.3 45. Louisiana 35.5 22. Ohio 23.2 46. Arkansas 37.1 23. Utah 24.1 47. Alabama 41.3 24. Nevada 24.3 48. Mississippi 41.6
Rank of Home State*State Undergraduates Alumni Vermont 1.4 1.9 Colorado 1.4 1.9 California 1.4 5.8 Maine 1.7 1.1 New Hampshire 2.2 1.8 New York 3.4 8.1 Rhode Island 4.0 14.9 Massachusetts 6.6 10.9 Virginia 6.8 10.2 Pennsylvania 8.0 5.9 Connecticut 9.8 7.5 Illinois 12.3 12.1 Ohio 13.1 23.1 New Jersey 18.0 16.3 Florida 20.4 5.4 *Only those states with 10 or more undergraduates and 10 or more alumni respondents claiming it as "home" are included. Seventy per cent of all alumni responses are represented here.
Robert E. Huke '48 is Professor of Geography at the College.His spatial preference is for Vermont.