THE CLASS OF 1931
The Class of 1931 seems to be primarily notable for its unpleasant and unexpected size, its youth, and its uniquely large number of sons of Dartmouth alumni.
The unexpected size of the class is a very significant thing and one of which the college should be proud, even if the Director of Admissions is at least publicly ashamed, he having been instructed to admit a class of only 550. This small number was necessitated by the fact that everyone vitally interested, the President, the trustees, the faculty and alumni are insistent that the college shall not exceed two thousand; and by the further fact, that as result apparently of the Selective Process the upper classes "shrink" very much less than they formerly did. The Director of Admissions, therefore, selected in April a group which according to all previous guides and statistics should have yielded only about 550 men free of all entrance conditions and landed safe and sound in Hanover, via, White River Junction, at the time college opened. But this year practically every boy selected in April turned up as an enthusiastic member of the Class of 1931. In other words, very few of those selected had picked Dartmouth as a second choice and very few of those selected in April failed to have the requisite, though somewhat abused as well as overrated, fifteen units of entrance credits. Of course next year, the Director of Admissions will play other hunches with the possible result that he will be unhappier even than he is supposed to be with a class that is seventy-six too large, a class that numerically represents an error of approximately twelve percent.
The average age, in years, of recent classes beginning with 1925 has been 18.31, 18.35, 18.38, 18.39, 18.22, 18*39 but that of the Class of 1931 is only 17.9. This result came as a great surprise to the Director of Admissions as he had persuaded a large number of excellent but young applicants to take an additional year's ripening before being picked for admission to Dartmouth. The 17.9 years however must be explained and this is my guess. For many months the writer has felt that the material from which the Class of 1931 was chosen was much superior scholastically to that of any previous year. In fact, he has often stated that at least 300 applicants were refused this year who would have been selected in previous years. Th.s excellence of the raw material from which 1931 was fashioned accounts for the youth of its members—it is a bright class. "Incidentally, the class contains an extremely young boy of fourteen years and seven months. It is more than possible that the Director of Admissions will eventually be able to admit a son and his father to the same class.
Forty-five members of the Class of 1931, in other words seven percent of the class are sons of Dartmouth Alumni, much the highest percentage we have ever had. The writer does not worry over this situation, however, because the most recent scientific and practical experiments at least in horse breeding indicate that fears of inbreeding are the result of superstitions not founded on facts.
Speaking about the size of the Class of 1931 reminds me that alumni may be interested in the application list from which the class was chosen. Altogether 2235 men filed application for admission to this class. During the spring and summer months, this list was severely pruned by the office of admissions, but up to the last minute approximately 1600 men were hopeful of entering this year. It may be of interest in this connection to analyze briefly some of the reasons given by applicants for having chosen Dartmouth, each applicant having been asked on his application blank to "give one clear reason for choosing Dartmouth as your college."
REASONS FOR CHOOSING DARTMOUTH
Location 100 Influence of alumni 82 High scholastic standing 79 Fame of the College 57 Influence of alumni relatives 52 The curriculum 51 Tuck School 40 Cosmopolitan democracy 39 Well-rounded education 28
No comments are needed on the above table, which of course lists only the most frequent reasons given, but sometime perhaps the writer will analyze some of the less numerous but more humorous answers. Incidentally one of the best answers received was "because of President Hopkins' statement that Dartmouth's aim is to make the mind a workshop not a storehouse."
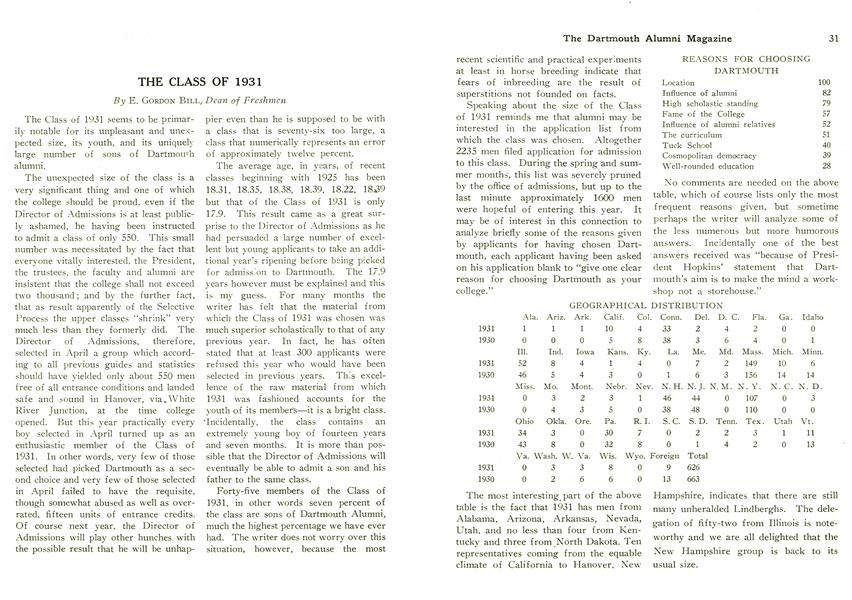
GEOGRAPHICAL DISTRIBUTION Ala. Ariz. Ark. Calif. Col. Conn. Del. D. C. Fla. Ga. Idaho 1931 1 1 1 10 4 33 2 4 2 0 0 1930 00058 38 36401 111. Ind. Iowa Kans. Ky. La. Me. Md. Mass. Mich. Minn. 1931 52 8 4 1 4 0 7 2 149 10 6 1930 46 5 4 3 0 1 6 3 156 14 14 Miss. Mo. Mont. Nebr. Nev. N. H. N.J. N. M. N. Y. N. C. N. D. 1931 0 3 2 3 1 46 44 0 107 0 3 1930 0 4 3 5 0 38 48 0 110 0 0 Ohio Okla. Ore. Pa. R.I. S. C. S. D. Tenn. Tex. Utah Vt. 1931 34 3 0 30 7 0 2 2 3 1 11 1930 43 8 0 32 8 0 1 4 2 0 13 Va. Wash. W. Va. Wis. Wyo. Foreign Total 1931 0 3 3 8 0 9 626 1930 0 2 6 6 0 13 663
The most interesting part of the above table is the fact that 1931 has men from Alabama, Arizona, Arkansas, Nevada, Utah, and no less than four from Kentucky and three from North Dakota. Ten representatives coming from the equable climate of California to Hanover, New Hampshire, indicates that there are still many unheralded Lindberghs. The delegation of fifty-two from Illinois is noteworthy and we are all delighted that the New Hampshire group is back to its usual size.
SECTIONAL DISTRIBUTION 1930 1931 New England 259 253 Middle Atlantic 196 185 Southern 31 23 Central 145 134 Rocky Mountain 12 9 Pacific 7 13 Foreign 13 9 Total 663 626
The New England percentage of 40.4 is a slight increase over that of last year. Possibly the size of this particular group is becoming fairly constant after years of decrease, in spite of the claim that the economic center of the country is going to be somewhere near San Francisco Bay. The total southern delegation has fallen off slightly this year but the writer feels that its distribution indicates the most general representation of the real South we have ever had. It is only fair to say that as a Nova Scotian, the Director of Admissions is very sweet on real southern boys. The Pacific delegation has perceptibly increased and the foreign group represents Argentina, Canada, Costa Rica, China, Ecuador, Mexico, and Porto Rico, with one yet to come from Guatemala via France. Certainly the South American representation at a northern New England College is remarkable.
FAVORED GROUPS 1930 1931 Alumni 36 44 New Hampshire 38 46 West of Mississippi 60 51 South of the Ohio and Potomac 21 16 Foreign 13 9
Perhaps it is well to recall to readers of this analysis that one section of the Selective Process provides that "selection shall be made of all properly qualified members of the following groups: Sons of Dartmouth College alumni and Dartmouth College officers; residents of the State of New Hampshire; and residents of districts west of the Mississippi, and of districts south of the Potomac and Ohio Rivers." As has often been pointed out the couplet "properly qualified" has been a life-saver to the Director of Admissions. Not all applicants by any means from the above group secure admission to Dartmouth on presentation of fifteen perfectly good units, but the provision quoted above is much more than a gesture. The only changes at all significant in the constituents of the favored groups of 1931 have already been mentioned : the increase in the number of sons of alumni and in residents of New Hampshire.
OCCUPATIONS OF PARENTS 1930 1931 Business Executive 106 136 Merchant 79 56 Manufacturer 57 47 Physician 39 24 Lawyer 36 39 Banker 31 11 Artisan 27 34 Engineer 27 28 Realtor 26 25 Education 21 20 Salesman 19 17 Insurance 17 15 Farmer 12 13 Civil Service 12 11 Druggist 9 2 Broker 8 16 Clerk 9 7 Municipal Officer 7 1 Hotel 7 3 Editor 6 3 Printer 5 6 Advertising 5 4 Accountant ' 5 6 Dentist 5 6 Chemist 33 Ship Captain 3 1 Contractor 2 20 Clergyman 0 9 Judge 4 0 Retired 14 16 Deceased 44 22 Miscellaneous 18 25 Total 663 626
In spite of all misleading statistics— and all statistics are misleading to someone —which have recently appeared in the Press as a result of a so-called religious census of the student body at Dartmouth, I would like to call attention to the fact that the Class of 1931 contains nine sons of clergymen, the largest number for several years. We always expect great things from boys with such backgrounds. Business executives and contractors seem at the present moment to be very keen on Dartmouth, but merchants, bankers, judges, and physicians seem temporarily to have lost their grip. All in all the entering group represents a very healthy occupational cross section. Incidentally, tucked away among the miscellaneous are such boys as sons of a governor-general, chiropodist, two missionaries, a janitor, and three railroad conductors. Perhaps, I should call attention to the fact that I am more worried this year than last over the future of the bee industry, as 1931 contains no son of a podiatrist.
Speaking of occupations of parents, it may be of interest to analyze briefly the answers given by applicants eight months before admission in response to the request "If you have planned on any definite vocation, name it."
PROPOSED VOCATIONS Business 125 Law 77 Medicine 58 Engineering 22 Education 19 Journalism 13 Chemistry 7 Advertising 6 Architecture 4 Science 4 Diplomatic Service 3 Art 2 Dramatics 1 Archeology 1 Missionary 1 Naval Officer 1 Theology 1 Undertaker 1 Athletic Coach 1 Nursery Business 1 None 278
It seems a shame to add that since college opened the writer has seen about 250 members of the class in a personal way and has asked them casually what they expected to do after college. In general, it has seemed to him that the boys from the 278 listed above as "none" seemed to be now pretty sure about what they hoped to do but that the others were somewhat in doubt. This statement somewhat discombobulates the above table but is a healthy sign. In any case, Dartmouth has been and is probably doing more and more intelligent work in the guidance of these boys in choosing their future careers than most educational institutions. In fact, this service is being so intelligently handled that comparatively few now graduating from Dartmouth will start off in some work absolutely foreign to their best capabilities. In passing, it should be said that in all probability, the nursery business above refers to trees and shrubs.
CHURCH PREFERENCES 1930 1931 Baptist 38 23 Christian 3 4 Christian Science 24 18 Congregational 135 144 Dutch Reformed 4 2 Episcopal 107 115 Ethical Culture 1 0 Jewish 37 43 Lutheran 12 12 Methodist 70 39 Presbyterian 96 96 Roman Catholic 71 70 Unitarian 20 30 United Brethren 2 0 Universalist 10 8 Miscellaneous 5 16 No preference 28 6 Total 663 626
In general and for any one year the above statistics mean exactly nothing, although they give the writer a chance to write. As the Class of 1931 is smaller than 1930, the increase in the representation of Congregational, Episcopal, Jewish and Unitarian Churches is at least worth mentioning here. The very decided decrease in the number of students with Methodist affiliations will seem to mean something if its persists another year. Perhaps I should add that for the first time in recent years the class contains a member of the Mormon Church.
COLLEGE TRAINING OF PARENTS 1930 1931 Sons of Dartmouth alumni 36 45 Colleges other than Dartmouth 176 179 Number of colleges 78 78 College mothers 61 71 Number of colleges 38 49 Both parents college bred 35 49
The only significant feature of the above tabulation is the fact that considerably more boys in 1931 have college trained mothers than in other years and consequently considerably more have both parents properly trained to help pick their son's college. Seven fathers were educated at M. I. T., five at Illinois, four each at Cornell, Michigan, and Wesleyan. Eight mothers were girls at Smith, four at Hunter, three at Northwestern.
SCHOOL REPRESENTATION No. No. No. of from from Schools Public Private Public Private 1931 345 241 104 363 262 1930 347 238 109 387 274
As usual the Director of Admissions gets a real thrill out of the analysis of the secondary school representation of the freshman class because he believes it to be unique among the colleges and he knows its preservation is a vital part of Dartmouth's future. No less than 345 schools are represented in this class of 626 boys and the distribution between public and private schools is, proportionally to the size of the class, almost exactly what it was last year, about 58% coming direct from high schools and 42% having at least one final year in preparatory schools.
NUMBER OF STUDENTS FROM A SCHOOL 1 2 3 4 5 6 7 8 9 10 11 12 20 26 1931 223 64 36 7 6 2 3 0 2 0 1 0 1 1 1930 223 59 31 14 6 4 4 33 2 1 1 0 0
Once again exactly 223 schools sent us one boy, a magnificent piece of leaven for any liberal arts college lump. However, this year we have somewhat larger maximum delegations than usual, 26 coming from Exeter and 20 from Andover. The largest high school groups were Newton, Mass., 6, and 5 each from Brockton, Manchester Central, Springfield Central, and Evanston, Ill.
METHODS OF ADMISSION 1930 1931 Certificate 528 508 Examination 51 42 Examination and Certificate 76 75 "Special Certificate" 303 338
The only important change indicated in the above table is the fact that 338, that is 54% of the class, entered by "Special Certificate" by virtue of having ranked in the highest quarter of their entire class during their last two years of preparation. Unquestionably, many other men could have presented their credits by "Special Certificate" but entered by ordinary certificate, as it has been very difficult for us to make principals realize that the "Special Certificate" is the type of admission we prefer above all others. Many principals still feel that in some way this form is designed for lame ducks. It should perhaps be mentioned finally, that no one entered the Class of 1931 with conditions and only four were admitted with less than 15 credits, one of whom was a man from Argentina, who got fifty-eight in the fall entrance examination in English 2.
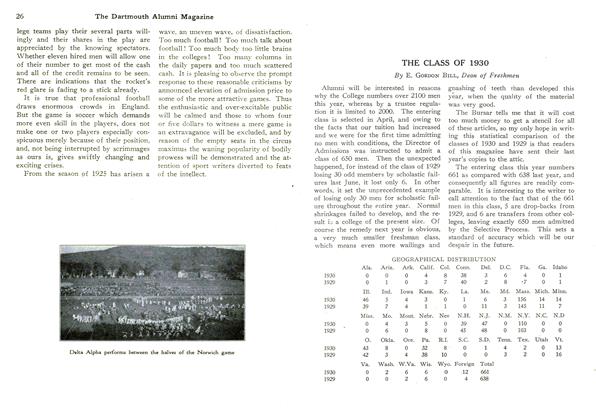
A small delegation from the freshman class
Dean of Freshmen