The Class of 1933
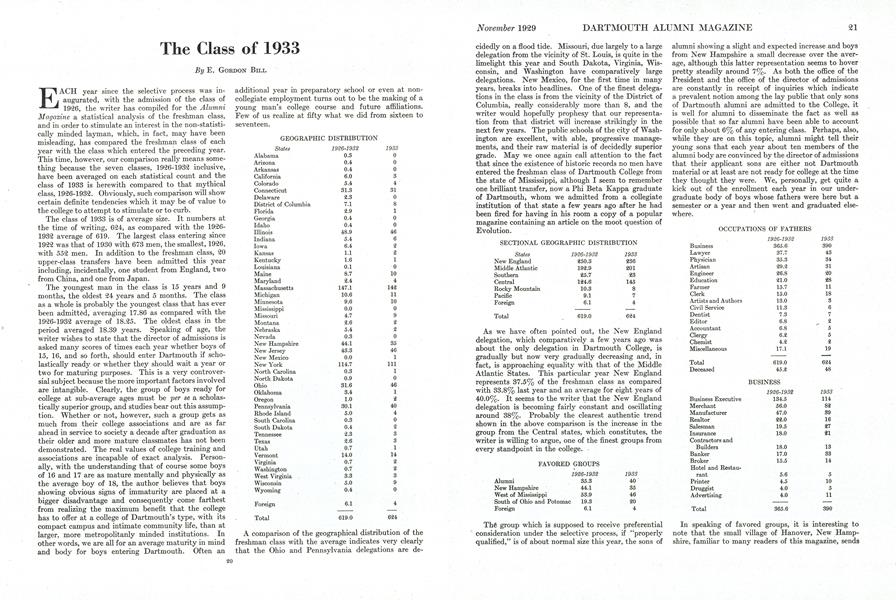
EACH year since the selective process was inaugurated, with the admission of the class of 1926, the writer has compiled for the AlumniMagazine a statistical analysis of the freshman class, and in order to stimulate an interest in the non-statistically minded layman, which, in fact, may have been misleading, has compared the freshman class of each year with the class which entered the preceding year. This time, however, our comparison really means something because the seven classes, 1926-1932 inclusive, have been averaged on each statistical count and the class of 1933 is herewith compared to that mythical class, 1926-1932. Obviously, such comparison will show certain definite tendencies which it may be of value to the college to attempt to stimulate or to curb.
The class of 1933 is of average size. It numbers at the time of writing, 624, as compared with the 19261932 average of 619. The largest class entering since 1922 was that of 1930 with 673 men, the smallest, 1926, with 552 men. In addition to the freshman class, 20 upper-class transfers have been admitted this year including, incidentally, one student from England, two from China, and one from Japan.
The youngest man in the class is 15 years and 9 months, the oldest 24 years and 5 months. The class as a whole is probably the youngest class that has ever been admitted, averaging 17.86 as compared with the 1926-1932 average of 18.25. The oldest class in the period averaged 18.39 years. Speaking of age, the writer wishes to state that the director of admissions is asked many scores of times each year whether boys of 15, 16, and so forth, should enter Dartmouth if scholastically ready or whether they should wait a year or two for maturing purposes. This is a very controversial subject because the more important factors involved are intangible. Clearly, the group of boys ready for college at sub-average ages must be per se a scholastically superior group, and studies bear out this assumption. Whether or not, however, such a group gets as much from their college associations and are as far ahead in service to society a decade after graduation as their older and more mature classmates has not been demonstrated. The real values of college training and associations are incapable of exact analysis. Personally, with the understanding that of course some boys of 16 and 17 are as mature mentally and physically as the average boy of 18, the author believes that boys showing obvious signs of immaturity are placed at a bigger disadvantage and consequently come farthest from realizing the maximum benefit that the college has to offer at a college of Dartmouth's type, with its compact campus and intimate community life, than at larger, more metropolitanly minded institutions. In other words, we are all for an average maturity in mind and body for boys entering Dartmouth. Often an additional year in preparatory school or even at noncollegiate employment turns out to be tlie making of a young man's college course and future affiliations. Few of us realize at fifty what we did from sixteen to seventeen.
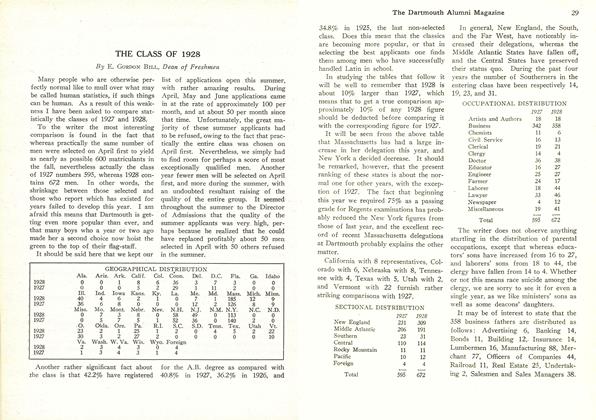
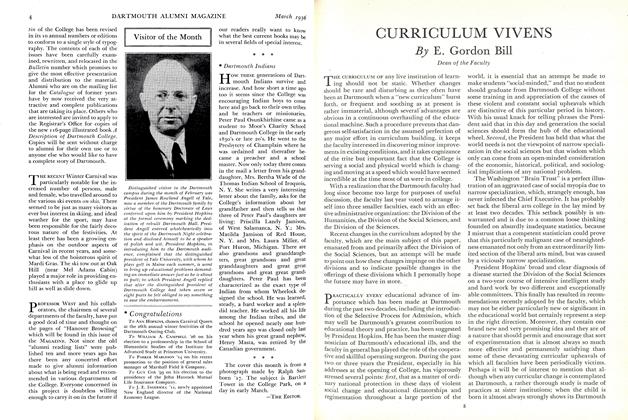
GEOGRAPHIC DISTRIBUTION States 1936-1932 1933 Alabama 0.3 0 Arizona 0.4 0 Arkansas 0.4 0 California 6.0 3 Colorado 5.4 4 Connecticut 31.3 31 Delaware 2.3 0 District of Columbia 7.1 8 Florida 2.9 1 Georgia 0.4 0 Idaho 0.4 0 Illinois 48.9 46 Indiana 5.4 6 Iowa 6.4 2 Kansas 1.1 2 Kentucky 1.6 1 Louisiana 0.1 0 Maine 8.7 10 Maryland 2.4 4 Massachusetts 147.1 142 Michigan 10.6 11 Minnesota 9.6 10 Mississippi 0.0 0 Missouri 4.7 9 Montana 2.6 2 Nebraska 5.4 2 Nevada 0.3 0 New Hampshire 44.1 35 New Jersey 43.3 46 New Mexico 0.0 1 New York 114.7 111 North Carolina 0.3 1 North Dakota 0.9 0 Ohio 31.6 46 Oklahoma 3.4 1 Oregon 10 2 Pennsylvania 30.1 40 Rhode Island 5.0 4 South Carolina 0.3 0 South Dakota 0.4 2 Tennessee 2.3 3 Texas 2.6 3 Utah 0.7 1 Vermont 14.0 14 Virginia 0.7 2 Washington 0.7 2 West Virginia 3.3 3 Wisconsin 5.0 9 Wyoming 0.4 0 Foreign 6.1 4 Total 619.0 624
A comparison of the geographical distribution of the freshman class with the average indicates very clearly that the Ohio and Pennsylvania delegations are decidedly on a flood tide. Missouri, due largely to a large delegation from the vicinity of St. Louis, is quite in the limelight this year and South Dakota, Virginia, Wisconsin, and Washington have comparatively large delegations. New Mexico, for the first time in many years, breaks into headlines. One of the finest delegations in the class is from the vicinity of the District of Columbia, really considerably more than 8, and the writer would hopefully prophesy that our representation from that district will increase strikingly in the next few years. The public schools of the city of Washington are excellent, with able, progressive managements, and their raw material is of decidedly superior grade. May we once again call attention to the fact that since the existence of historic records no men have entered the freshman class of Dartmouth College from the state of Mississippi, although I seem to remember one brilliant transfer, now a Phi Beta Kappa graduate of Dartmouth, whom we admitted from a collegiate institution of that state a few years ago after he had been fired for having in his room a copy of a popular magazine containing an article on the moot question of Evolution.
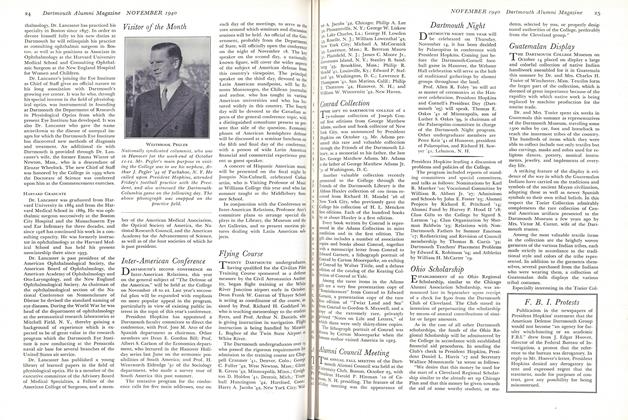
SECTIONAL GEOGRAPHIC DISTRIBUTION States 1926-1932 193S New England 250.3 236 Middle Atlantic 192.9 201 Southern 25.7 23 Central 124.6 145 Rocky Mountain 10.3 8 Pacific 9.1 7 Foreign 6.1 4 Total 619.0 624
As we have often pointed out, the New England delegation, which comparatively a few years ago was about the only delegation in Dartmouth College, is gradually but now very gradually decreasing and, in fact, is approaching equality with that of the Middle Atlantic States. This particular year New England represents 37.5% of the freshman class as compared with 33.8% last year and an average for eight years of 40.0%. It seems to the writer that the New England delegation is becoming fairly constant and oscillating around 38%. Probably the clearest authentic trend shown in the above comparison is the increase in the group from the Central states, which constitutes, the writer is willing to argue, one of the finest groups from every standpoint in the college.
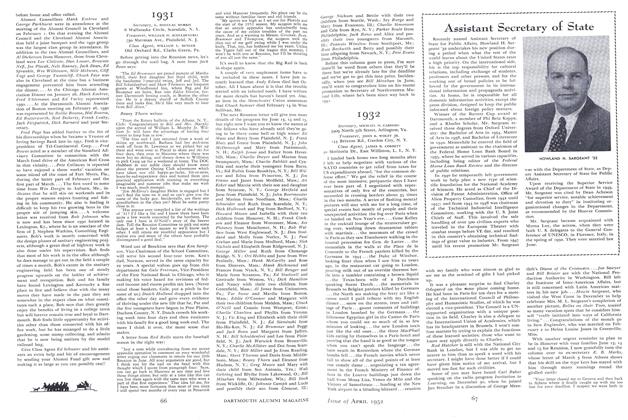
FAVORED GROUPS 1926-1932 1933 Alumni 35.3 40 New Hampshire 44.1 35 West of Mississippi 53.9 46 South of Ohio and Potomac 19.3 20 Foreign 6.1 4
The group which is supposed to receive preferential consideration under the selective process, if "properly qualified," is of about normal size this year, the sons of alumni showing a slight and expected increase and boys from New Hampshire a small decrease over the average, although this latter representation seems to hover pretty steadily around 7%. As both the office of the President and the office of the director of admissions are constantly in receipt of inquiries which indicate a prevalent notion among the lay public that only sons of Dartmouth alumni are admitted to the College, it is well for alumni to disseminate the fact as well as possible that so far alumni have been able to account for only about 6% of any entering class. Perhaps, also, while they are on this topic, alumni might tell their young sons that each year about ten members of the alumni body are convinced by the director of admissions that their applicant sons are either not Dartmouth material or at least are not ready for college at the time they thought they were. We, personally, get quite a kick out of the enrollment each year in our undergraduate body of boys whose fathers were here but a semester or a year and then went and graduated elsewhere.
OCCUPATIONS OF FATHERS 1926-1932 1933 Business 365.6 390 Lawyer 37.7 43 Physician 35.3 34 Artisan 29.2 31 Engineer 26.8 20 Education 21.0 28 Farmer 15.7 11 Clerk 15.0 18 Artists and Authors 13.0 3 Civil Service 11.3 6 Dentist 7.3 7 Editor 6.8 2 Accountant 6.8 5 Clergy 6.2 5 Chemist 4.2 2 Miscellaneous 17.1 19 Total 619.0 624 Deceased 45.2 48 BUSINESS 1926-1932 1933 Business Executive 134.5 114 Merchant 56.0 82 Manufacturer 47.0 39 Realtor 22.0 16 Salesman 19.5 27 Insurance 18.0 21 Contractors and Builders 18.0 13 Banker 17.0 33 Broker 15.5 14 Hotel and Restau- rant 5.6 5 Printer 4.5 10 Druggist 4.0 5 Advertising 4.0 11 Total 365.6 390
In speaking of favored groups, it is interesting to note that the small village of Hanover, New Hampshire, familiar to many readers of this magazine, sends no less than 9 boys to the freshman class, 6 being sons of college officers.
The writer dreads each year commenting on the above table for the simple reason that it is in the nature of things necessarily an inexact analysis both because many boys do not know what their fathers' business actually is and, in the second place, those compiling the table are not infallible in allocating various odd vocations to the main headings. For example, the group designated "Business Executives" probably varies greatly from year to year in accuracy. However, it is clear that even with Mr. Hoover in the White House, lawyers' boys at Dartmouth are increasing at the expense of sons of engineers. Sons of men in the fields of formal education are waxing plentiful and the director of admissions is surprised and delighted each year with the number of sons of principals and superintendents of distant schools hitherto without formal connection with the college who want to enter Dartmouth. We have no idea what has happened to the sons of authors and artists and editors, but superficially it would seem that their fathers have become bankers. The clergy is holding its own with difficulty, and farmers, we regret exceedingly to note, are finding the going to an A.B. at Dartmouth hard to travel.
VOCATIONS Planned Considered Total Business 113 108 221 Lawyer 65 62 127 Physician 38 23 61 Artisan 0 0 0 Engineer 36 30 66 Education 18 18 36 Farmer 112 Clerk 0 0 0 Artists and Authors 4 12 16 Civil Service 3 4 7 Dentist 0 2 2 Editor 6 8 14 Accountant 2 0 2 Clergy 1 2 3 Scientist 7 17 24 Miscellaneous 4 7 11 Total 298 294 592 None Planned or Considered 32 Total 624
Up to the present year we have, for our own delectation, asked applicants if they had decided on any definite vocation to name it. Feeling that this form of inquiry had induced many replies simply to complete the blank, we decided this year to modify it, first asking the same question as indicated above along with a second one concerning a vocation that had not been decided on, but simply considered. If experience proves anything, the above table will be of interest to the reading public, but will be otherwise of absolutely no prophetic value. This very morning the writer interviewed about thirty boys and took pains to check up on their proposed vocations, the result being that there was positively no connection between their replies in the office and their answers on our admission blanks.
It is interesting to note that no member of the Class of 1933 plans to be an artisan or a clerk, although 49 of their fathers fall within these categories. A surprising number expect to be lawyers, little realizing the mental stamina and protracted labor necessary. The most important figure above is the number of those who plan on becoming engineers. This checks very definitely with the feeling the writer has had that the number of men in college who are actually going on with engineering is very positively on the increase. A really interesting and valuable study would be to check the above figures in each individual case at the end of senior year.
REASONS FOB CHOOSING DARTMOUTH Scholastic Standing 127 Impressions by Alumni and Undergraduates 103 General Reputation 93 Location and Environment 100 Its Graduate Schools 40 Its Curriculum 37 Dartmouth Ancestry 31 Its Size 23 The College Spirit 17 Friends' Advice 10 Non-coeducational 10 Eastern College 9 Outdoor Life 7 Principals' Recommendations 6 Athletic Reputation 6 Fathers' Wish 5 Close Contact with Students 5
Some years ago applicants were asked to write me a letter giving in detail their reasons for choosing Dartmouth. There was so much leeway in this type of inquiry that I received scores of answers that were fit at least for College Humor. I tried to capitalize this material by an article in this magazine at the time. This year applicants were held down to a very rigid type of inquiry, namely they were asked to state one clear reason for choosing Dartmouth. This has eliminated most of the humor, but the above table probably means something. Often, of course, a boy gave several reasons and we in general have listed all of them.
To the writer, the outstanding fact disclosed in the above table is that the scholastic standing of the college and its general reputation as an educational institution is incomparably the most important lure for applicants, this being given more than three hundred times as the reason for choosing Dartmouth. Although it is no surprise, it is also an impressive fact that so many men have been influenced through impressions made by alumni and undergraduates. We are surprised that so few men mentioned the Outing Club and the general outdoor life possible here, this having been a very large factor in the statistics compiled some years ago. No applicant actually mentioned the Outing Club and only three mentioned winter sports.
Many men in mentioning the scholastic standing of the college spoke of its liberal type of education, and included in location and environment are twenty references to the assumed lack of outside diversion here and nine references to the fact that Dartmouth is an Eastern College. Several men said they were coming here because of the progressiveness of the institution and others referred to the opportunity offered by the college for physical improvement. Needless to say, several specifically have come to Dartmouth because it is headed by President Hopkins. Several reasons hard to classify may be of interest, "Dartmouth is an isolated, middle-sized college with the peculiar reputation of having a moral undergraduate life existing there." "To impose New England ideals upon Southern traditions." "The intellectual, social, and physical are well balanced at Dartmouth."
Of course, there are a few references to the fact that Dartmouth is a he-man's college. One boy came because "Dartmouth was the best he could afford" and one simply yrites "Veni, Vidi, Audivi."
CHURCH PREFERENCES 1926-1932 1933 Baptist 33.4 31 Christian 4.1 6 Christian Science 20.1 26 Congregational 140.4 114 Dutch Reformed 3.6 1 Episcopal 105.7 114 Jewish 27.0 44 Lutheran 10.0 11 Methodist 54.0 51 Presbyterian 89.6 91 Roman Catholic 65.9 67 Unitarian 20.4 18 Universalist 7.6 6 Miscellaneous 8.9 17 No Preference 28.3 27 Total 619.0 624
Religiously, the freshman class seems strangely normal, the only variations visible without a microscope or a motive being in the Congregational, Episcopal, and Jewish faiths. An analysis of individual years during the last eight shows that the Congregationalists are certainly lapsing, the Episcopalians gaining, and those of Jewish faith, after a sudden spurt four years ago, about holding their own. For the classes of 1930, 1931, 1932, 1933, the percentages of Congregationalists have been 20.4, 23.0, 19.4, 18.3; Episcopalians, 16.1, 18.4, 18.1, 18.3; and Jewish, 5.6, 6.9, 7.9, 7.1. The number of heathen is about normal and probably should have included one boy who stated his preference as "Presbyterian or Jewish."
COLLEGE TRAINING OF PARENTS 1926-1938 1933 Sons of Dartmouth Alumni 35.3 40 College Trained Fathers 167.9 169 Number of Colleges— Fathers 78.3 76 College Trained Mothers 62.3 70 Number of Colleges— Mothers 37.9 46 Both Parents College Bred 37.7 54
The college background of the Class of 1933 is, on the paternal side normal, but the number of college mothers is decidedly increased and the number of both parents college-trained rather remarkably large. Among fathers, Columbia University ranks second to Dartmouth with 9 boys, M. I. T. with 7, and Harvard next with 4. It is interesting to note that 3 members of the class have Washington and Lee fathers. As to the mothers, Smith outclasses the field with 9 sons, followed by Boston University with 4 and Yassar and Wellesley with 3.
SCHOOL REPRESENTATION No. of No. from No. from No. fromSchools Public Private Public Private Colleges1926-1932 336.0 244.1 92.0 392.0 223.0 4.0 1933 316.0 223.0 93.0 379.0 240.0 5.0
Although there is little variation in the Class of 1933 from the average, it would seem that the number of men entering Dartmouth from private schools is increasing. This fact unquestionably means simply that more and more parents are giving their sons at least one additional year away from home in private school before entering college. Such boys are credited in the above statistics to the last school attended. Almost exactly 60% of the present class entered direct from high school.
NUMBER OF STUDENTS FROM A SCHOOL 1 3 3 4 5 6, 7, 8,9,10—Maximum1926-1932 212.4 67.7 22.6 10.9 6.9 4.0 2.4 5.7 20.9 1933 201.0 55.0 24.0 15.0 10.0 3.0 1.0 8.0 25.0
The most interesting exhibit in the above table is hidden. On the average 80.5 men have entered 1926- 1932 from schools sending 7or more men each. This year 101 men so entered. We have boasted year after year about our great number of one-boy schools. Probably we must now start generating enthusiasm for the other end of the line. Along in the middle, it should be noted that the number of 4 and 5-boy schools is decidedly on the increase, also. Among private schools, the Exeter delegation leads with 25 men followed by Andover with 21, Mercersburg 20, Deerfield 17, and Tabor 14. In the public school field, Evanston Township High leads with 9 representatives closely followed by Washington Central High with 8 and New Trier Township High with 7.
METHODS OF ADMISSION 1926-1933 1933 Certificate 504.4 508 Examination 42.7 42 Examination and Certificate 67.9 69 Transfer 4.0 5 "Special" Certificate 235.0 243
The Class of 1933 is, in respect to its methods of presenting formal entrance credits, completely normal.
We are sure that each class should have more men entering by "special" certificate than the statistics show. This is the form of admission credits we prefer, but for some reason or other principals persist in thinking the "special" certificate is designed for lame ducks instead of for the leaders. The philosophy back of the "special" certificate is simply that if a boy has ranked in the top quarter of his class (including girls) during his last two years in secondary school and has completed the required English and Mathematics preparation for college, he is ready to enter college without condition without regard to his other offerings.
Speaking of methods of admission, the alumni may be interested to know that our present system of in general permitting no men to enter with conditions and in permitting no men to complete their formal credits at the last minute by means of examinations in the fall of proposed entrance is not an indication of any highhat sign of exclusiveness on the part of the college, but is founded on the philosophy backed by statistics that the burden of proof is on boys who fail to complete their preparation in normal time. However, the office of admissions prides itself on its flexibility in handling individual cases on their merits and whenever it gets muscle-bound, the President of the College is delighted to apply the proper liniment. This year, being the initial one in which fall examinations were allowed only to preliminary candidates, permission for summer work and fall credits was given to 11 men. In addition, 5 men, 2 by presidential fiat, were admitted without condition who had less than fifteen units. Finally, the group in which the director of admissions is always most interested personally, namely, the group of socalled exceptions consisting of high-grade boys from schools which could not secure our general certificate privilege, is represented in the Class of 1933 by 7 men.
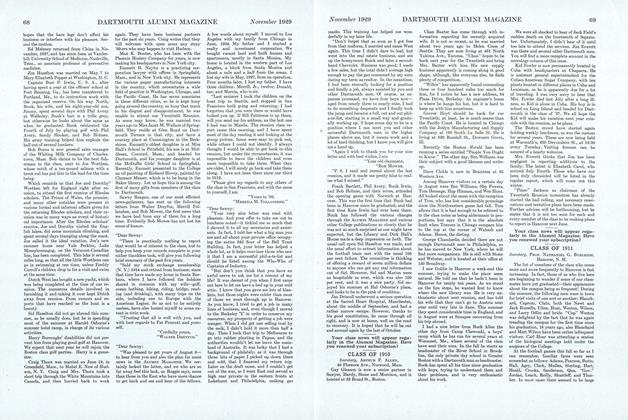
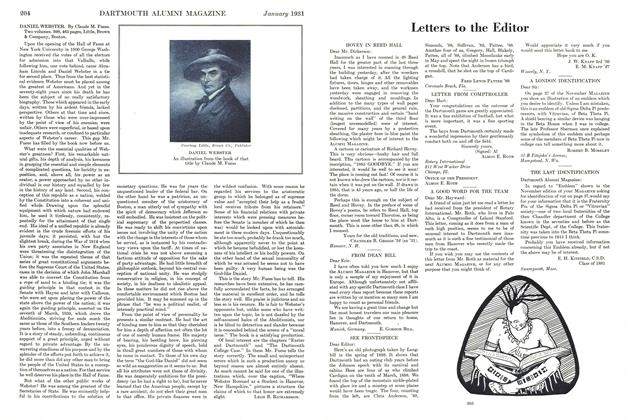
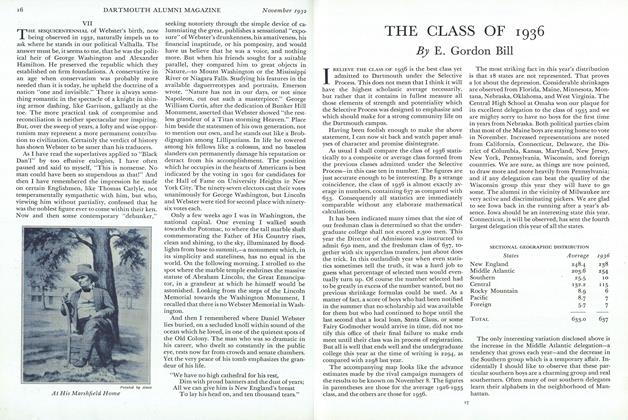
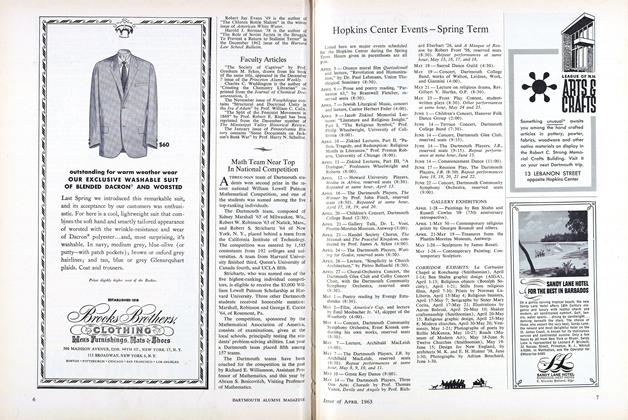
OUR SENIOR ALUMNUS (RIGHT) Taken with two distinguished classmates of 1864. Left to right, C. A. Bunker, W. T. Gage, J. W. Perkins, (Senior Alumnus)